
Comparing Your Hospital
To compare your hospital’s crime rate to the statistics above, the following formula can be used to calculate the rate per 100 beds:
Crime Rate = (x / Beds) * 100
where x is the total crime for each crime type and
Beds is the number of beds at your hospital
Example: (17 assaults / 360 beds) = 0.047 * 100 = 4.7 assaults per 100 beds
WORKPLACE VIOLENCE TYPOLOGY
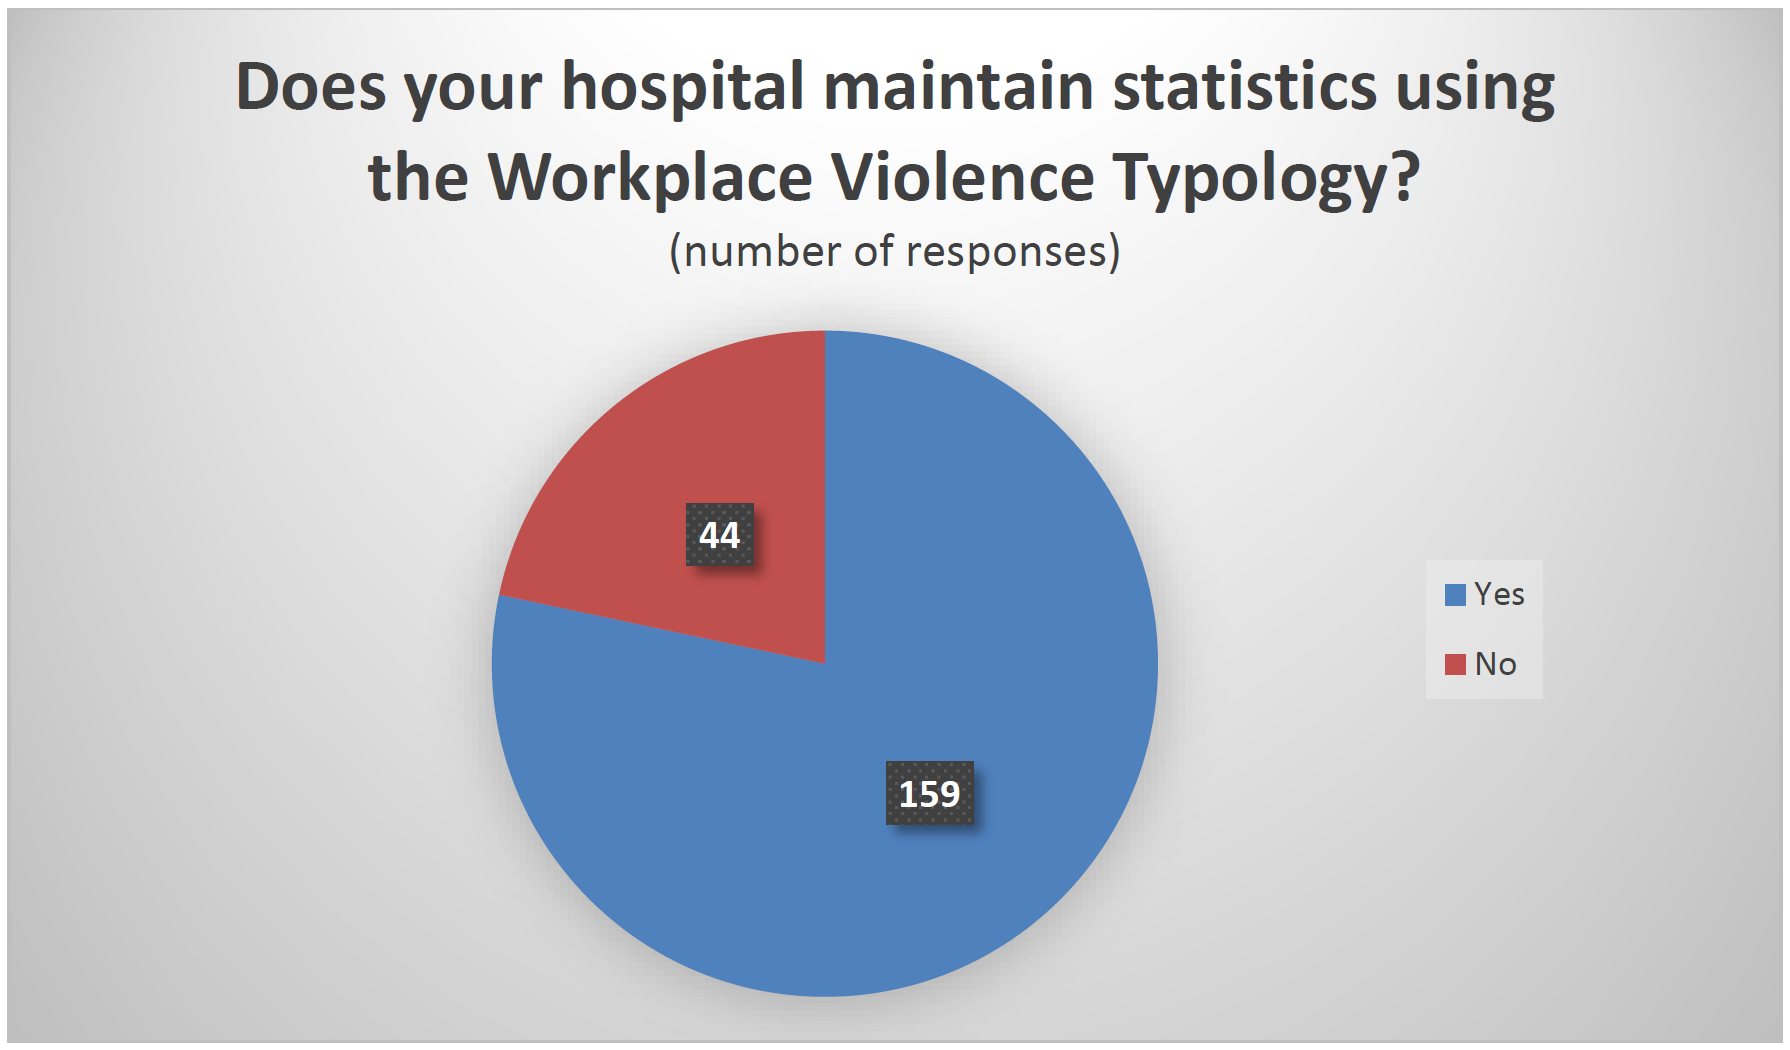
To drill down further into the assault numbers, we asked if hospitals maintain statistics using the Workplace Violence Typology. This classifies both aggravated assaults and simple assaults into four types.
- Workplace Violence Type 1: Violent acts by criminals, who have no other connection with the workplace, but enter to commit robbery or another crime
- Workplace Violence Type 2: Violence directed at employees by customers, clients, patients, students, inmates or any others for whom an organization provides services
- Workplace Violence Type 3: Violence against coworkers, supervisors or managers by a present or former employee
- Workplace Violence Type 4: Violence committed in the workplace by someone who does not work there but has a personal relationship with an employee, e.g., an abusive spouse or domestic partner
Of 203 responses, 78 percent said their hospitals record assault statistics according to this typology.
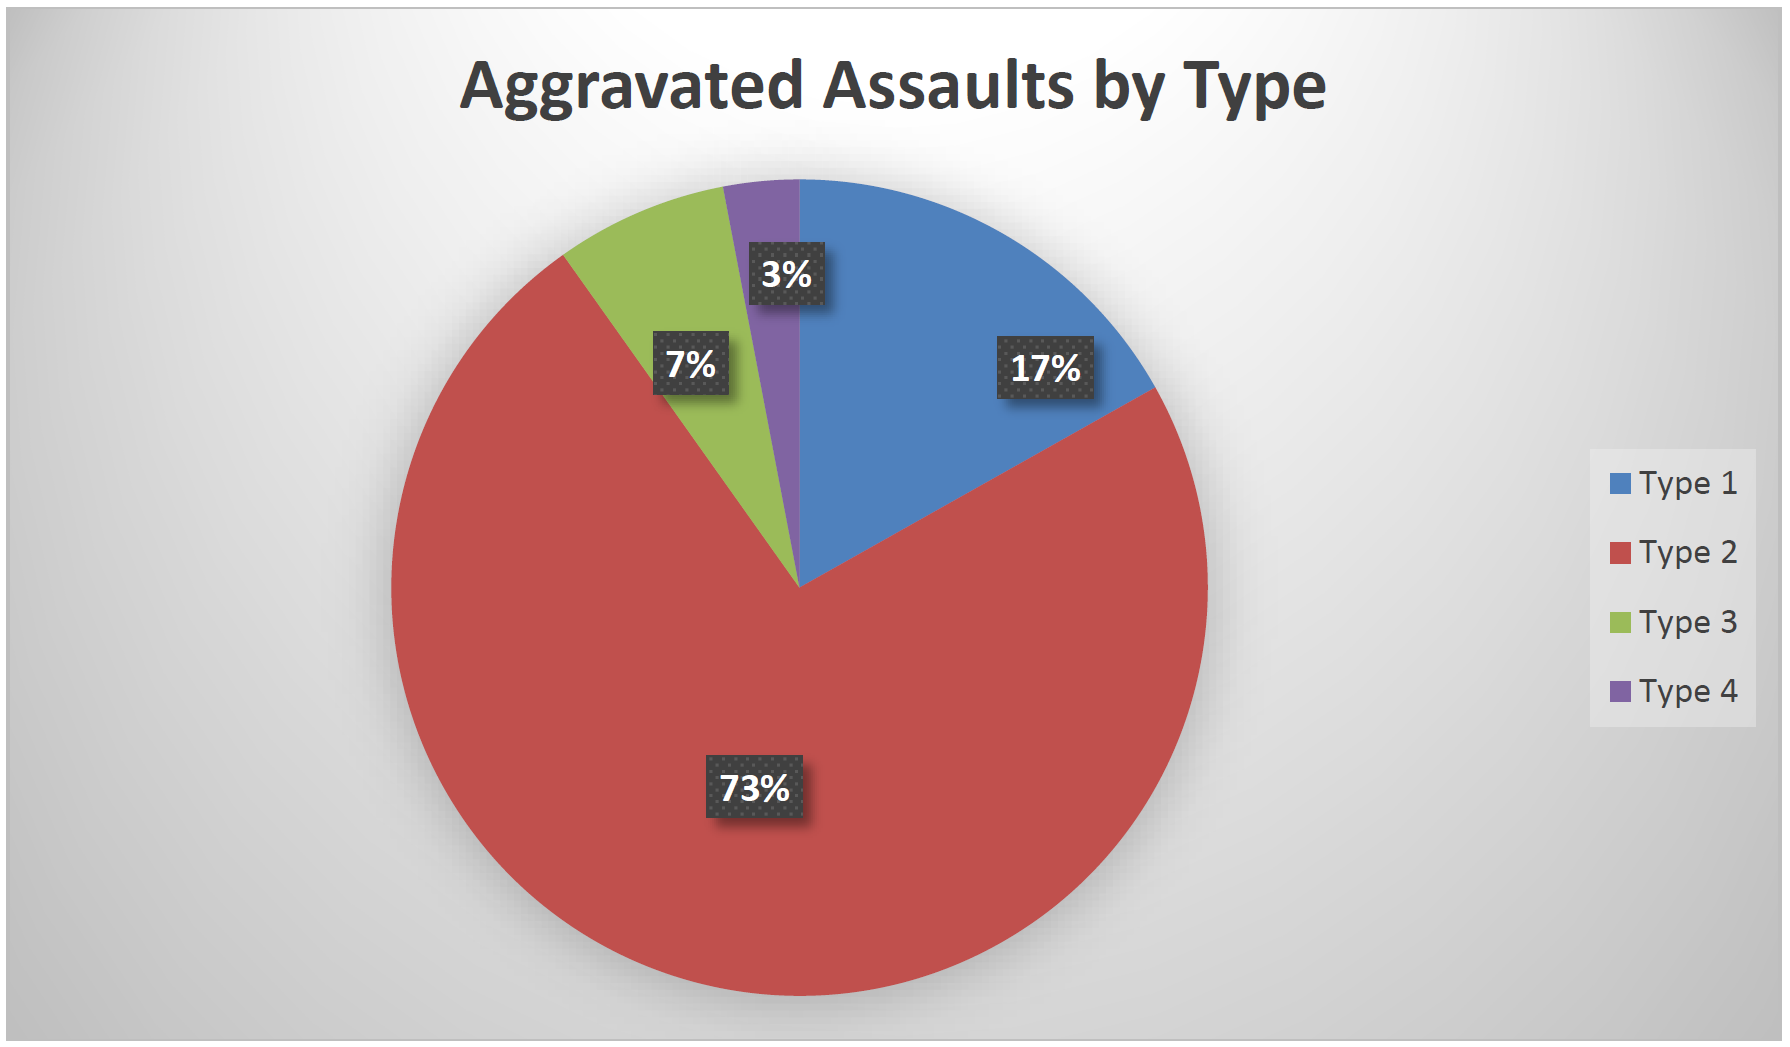
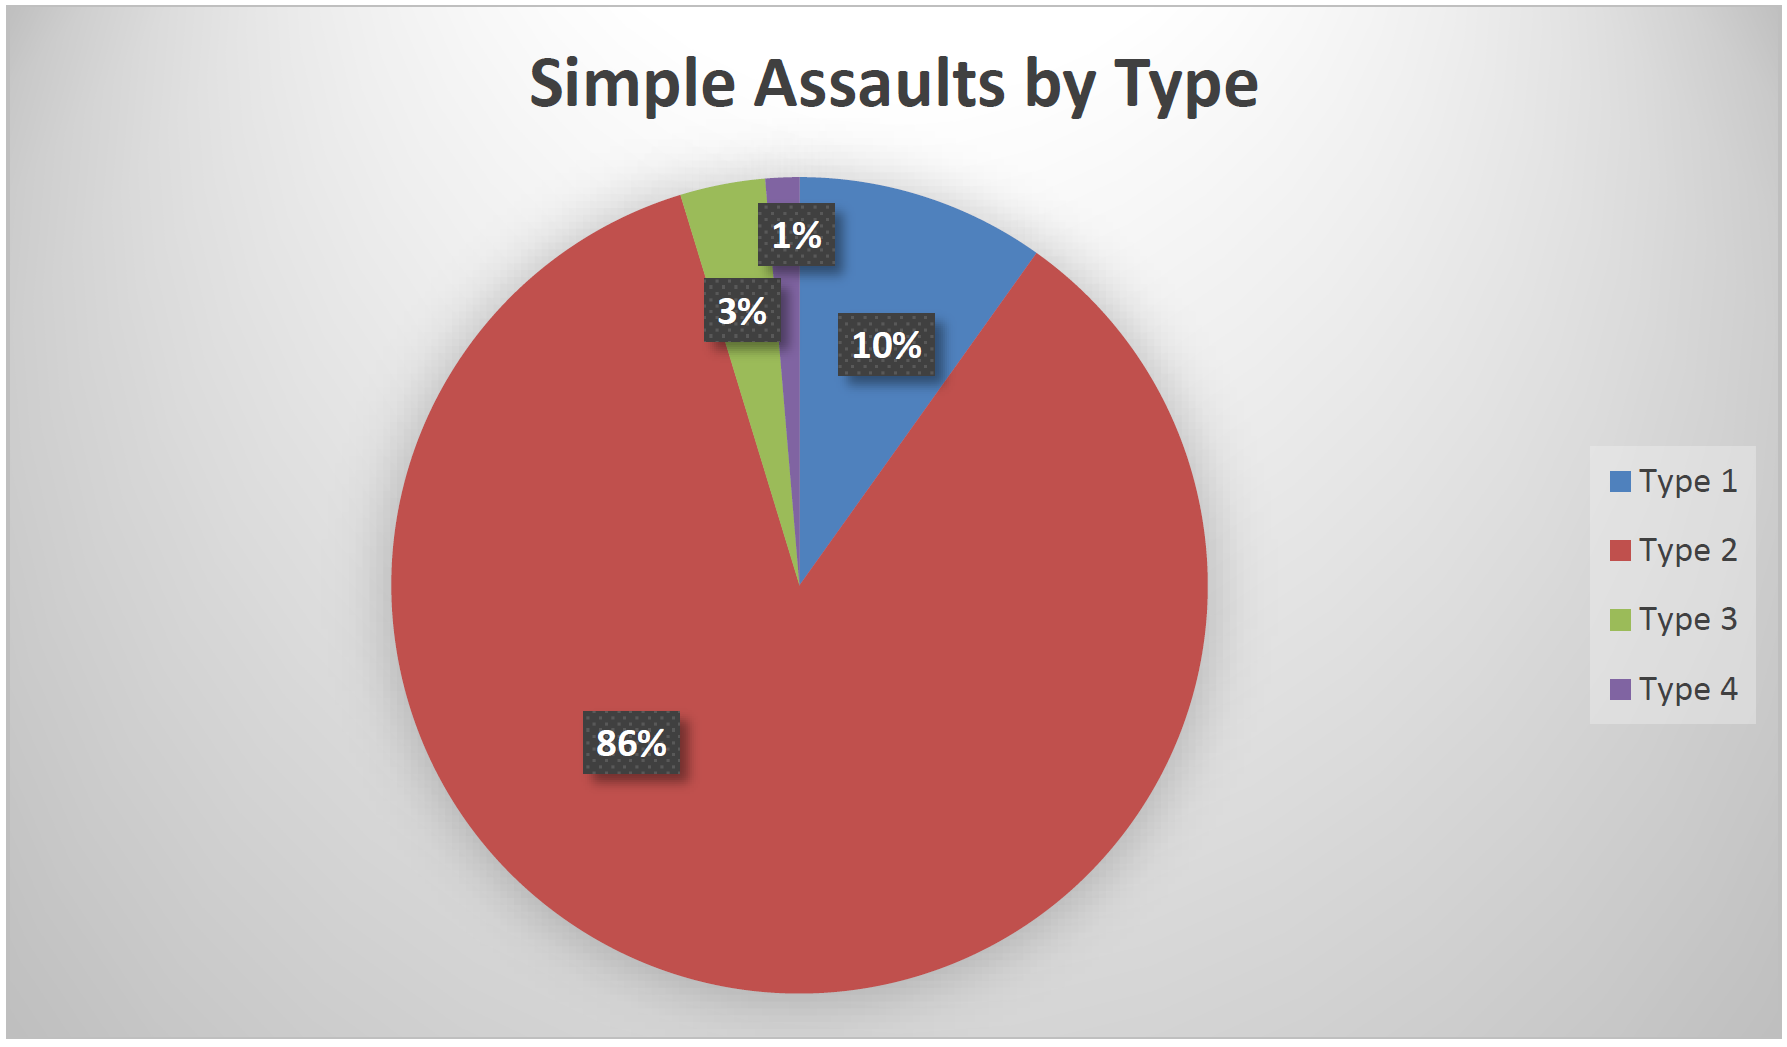
Among those reporting assaults by category, type 2 (violence directed at employees by non-employees) attacks were, by far, the most common, accounting for 73 percent of aggravated assaults and 86 percent of simple assaults.
ADDITIONAL QUESTIONS
In addition to inquiring about crime data, we asked respondents questions regarding specific aspects of their security operations.
Inpatient Psychiatric/Behavioral Unit
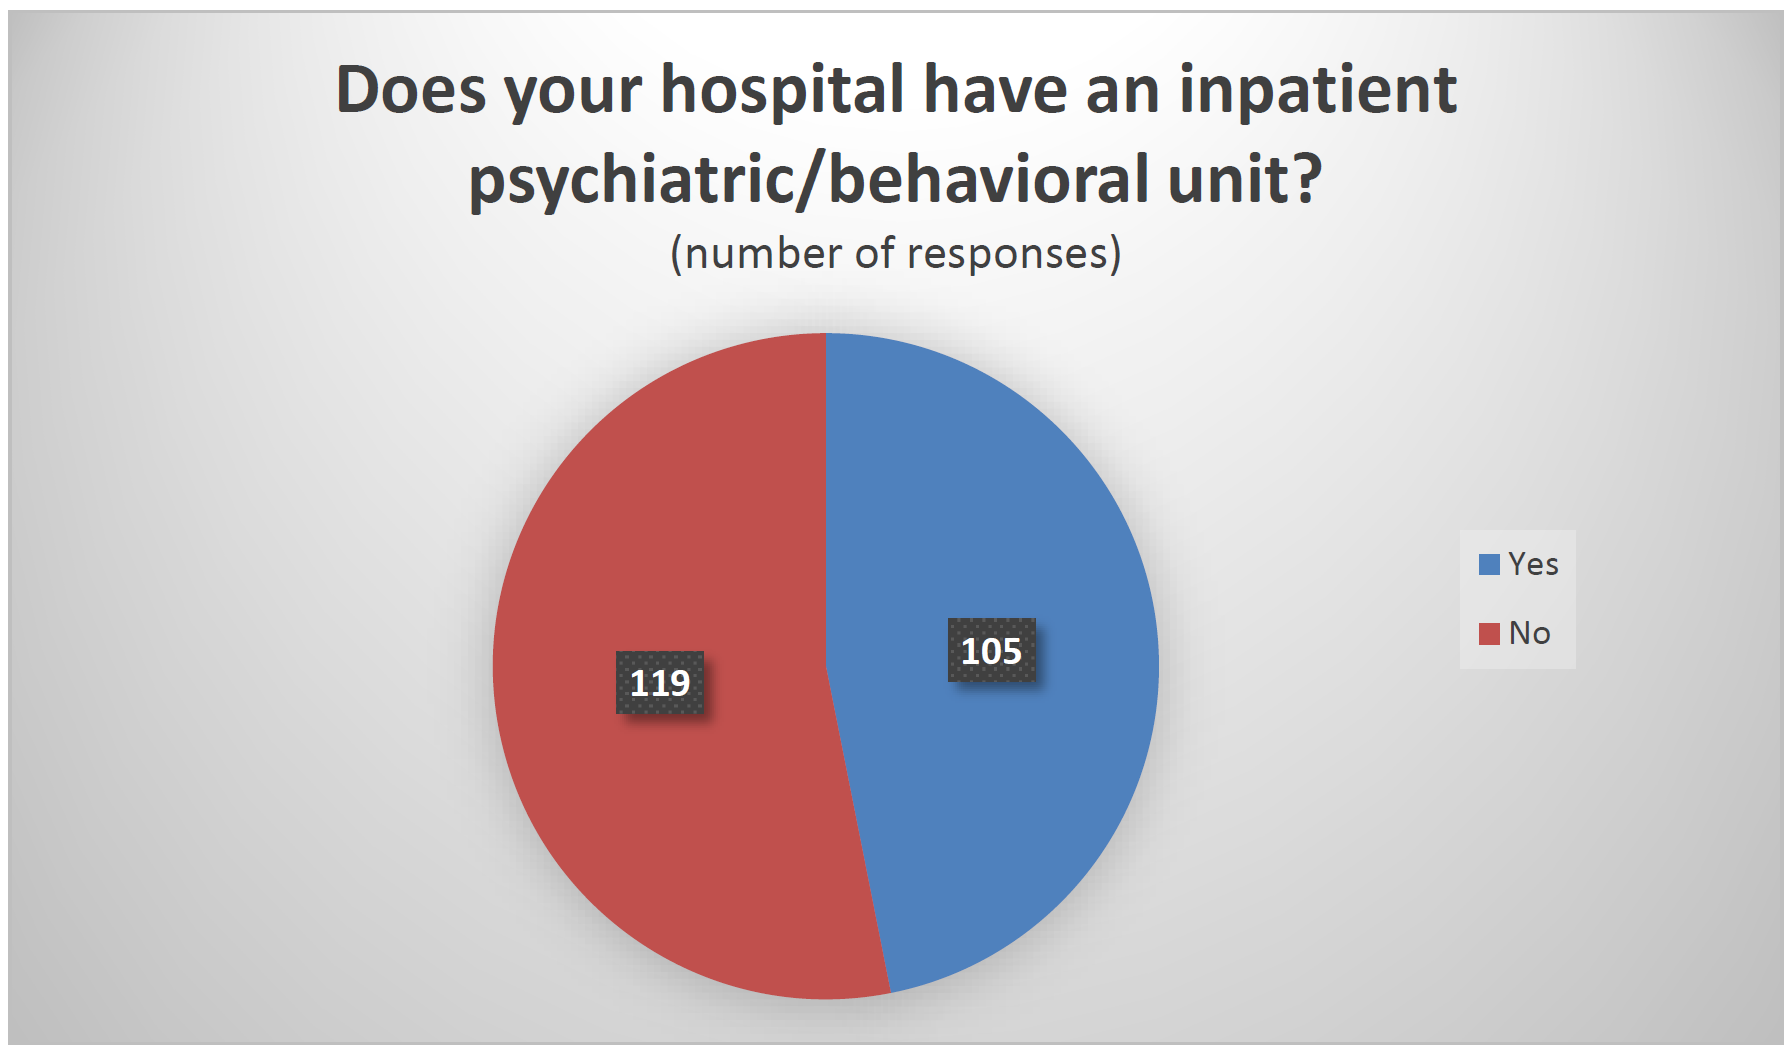
We asked if responding facilities had an inpatient psychiatric/behavioral unit. Of the 224 that provided an answer, 47 percent said yes.
Hospitals reporting the presence of an inpatient psychiatric/behavioral unit tended to be larger, averaging 399 beds and 11.1 full-time security employees per 100 beds, than those without such a unit, which averaged 234 beds and 10.4 security employees per 100 beds.
The rate of disorderly conduct in hospitals with these units was higher (75 per 100 beds vs. 32 per 100 beds), as was the rate of simple assault (20 vs. 14.9) and elopements (6.7 vs. 5.4).
The violent crime rate was higher in responding hospitals that did not have inpatient psychiatric/behavioral units (2.8 vs. 2.3). However, a single hospital without such a unit that reported a very large number of aggravated assaults, partly resulting from the use of a non-standard definition, inflated the average for facilities without these units. Removing this hospital lowered the violent crime rate for this group to 1.8 incidents per 100 beds. See the Limitations section (pp. 15-16) for more information.
Threat Management Teams
We asked respondents if their hospital uses threat management teams in security operations.
Although the term was not defined in the survey, a threat management team, generally speaking, is a tool aimed at reducing workplace violence by bring together individuals from various departments within an organization to assess threats, develop countermeasures, and intervene before violence occurs. Of the 227 total respondents, 211 provided an answer to this question, with 57 percent saying they do use threat management teams.
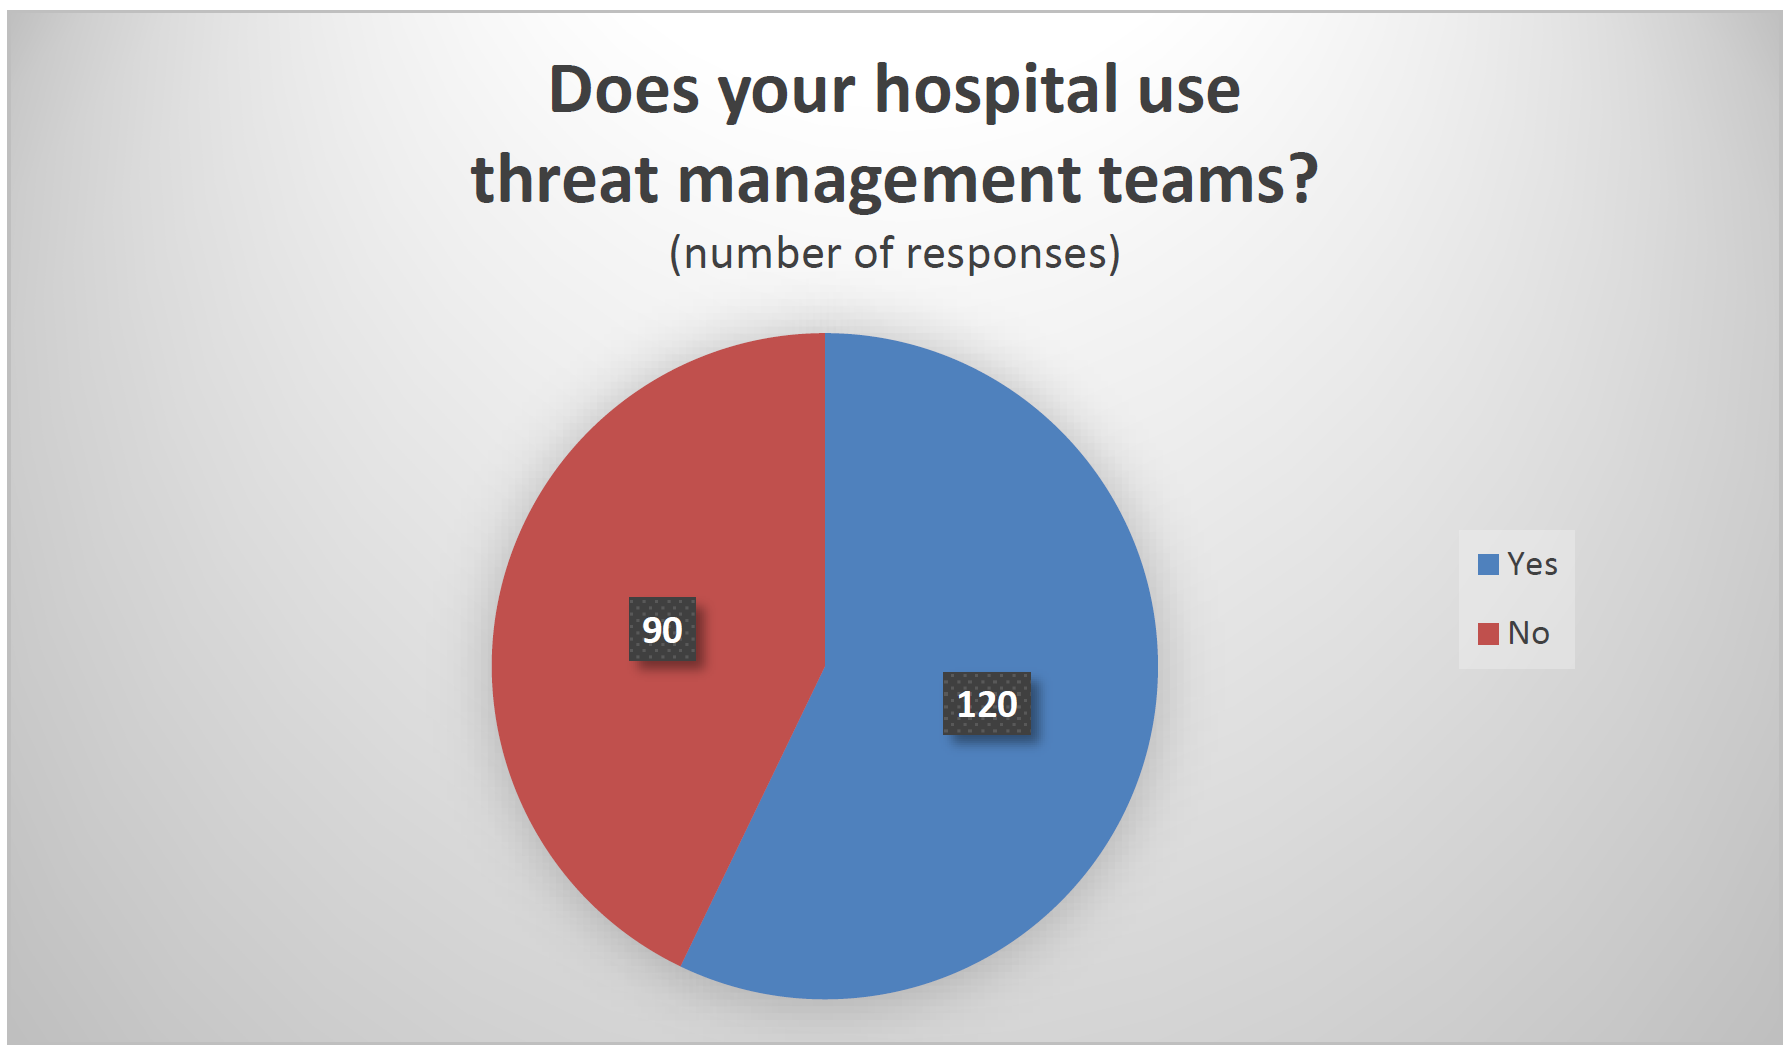
Hospitals reporting that they use threat management teams tended to be larger (342 beds per facility and 12.1 full-time security employees per 100 beds compared 279 and 9.2) and have higher rates of disorderly conduct (72.7 per 100 beds vs. 38.1), simple assaults (19.4 vs. 16), and elopements (7.2 vs. 4.7) than those that do not make use of such teams. The violent crime rate in hospitals without threat management teams was higher (2.8 vs. 2.3), but the outlier hospital mentioned in the previous section was a factor here, as well. This facility did not use threat management teams in 2021 and, without it, the violent crime rate for non-TMT hospitals was 1.7 incidents per 100 beds. See the Limitations section (pp. 15-16) for more information.
It should be noted that this data, alone, is insufficient to draw any conclusions about the effectiveness of threat management teams for multiple reasons. For example, it may be the case that hospitals facing higher rates of crime are more likely to implement threat management teams and similar measures.
Visitor Management Programs
We asked if hospitals used visitor management programs to track entry and exit to their facilities by people other than staff and patients. Of 222 responses, 82 percent said yes.
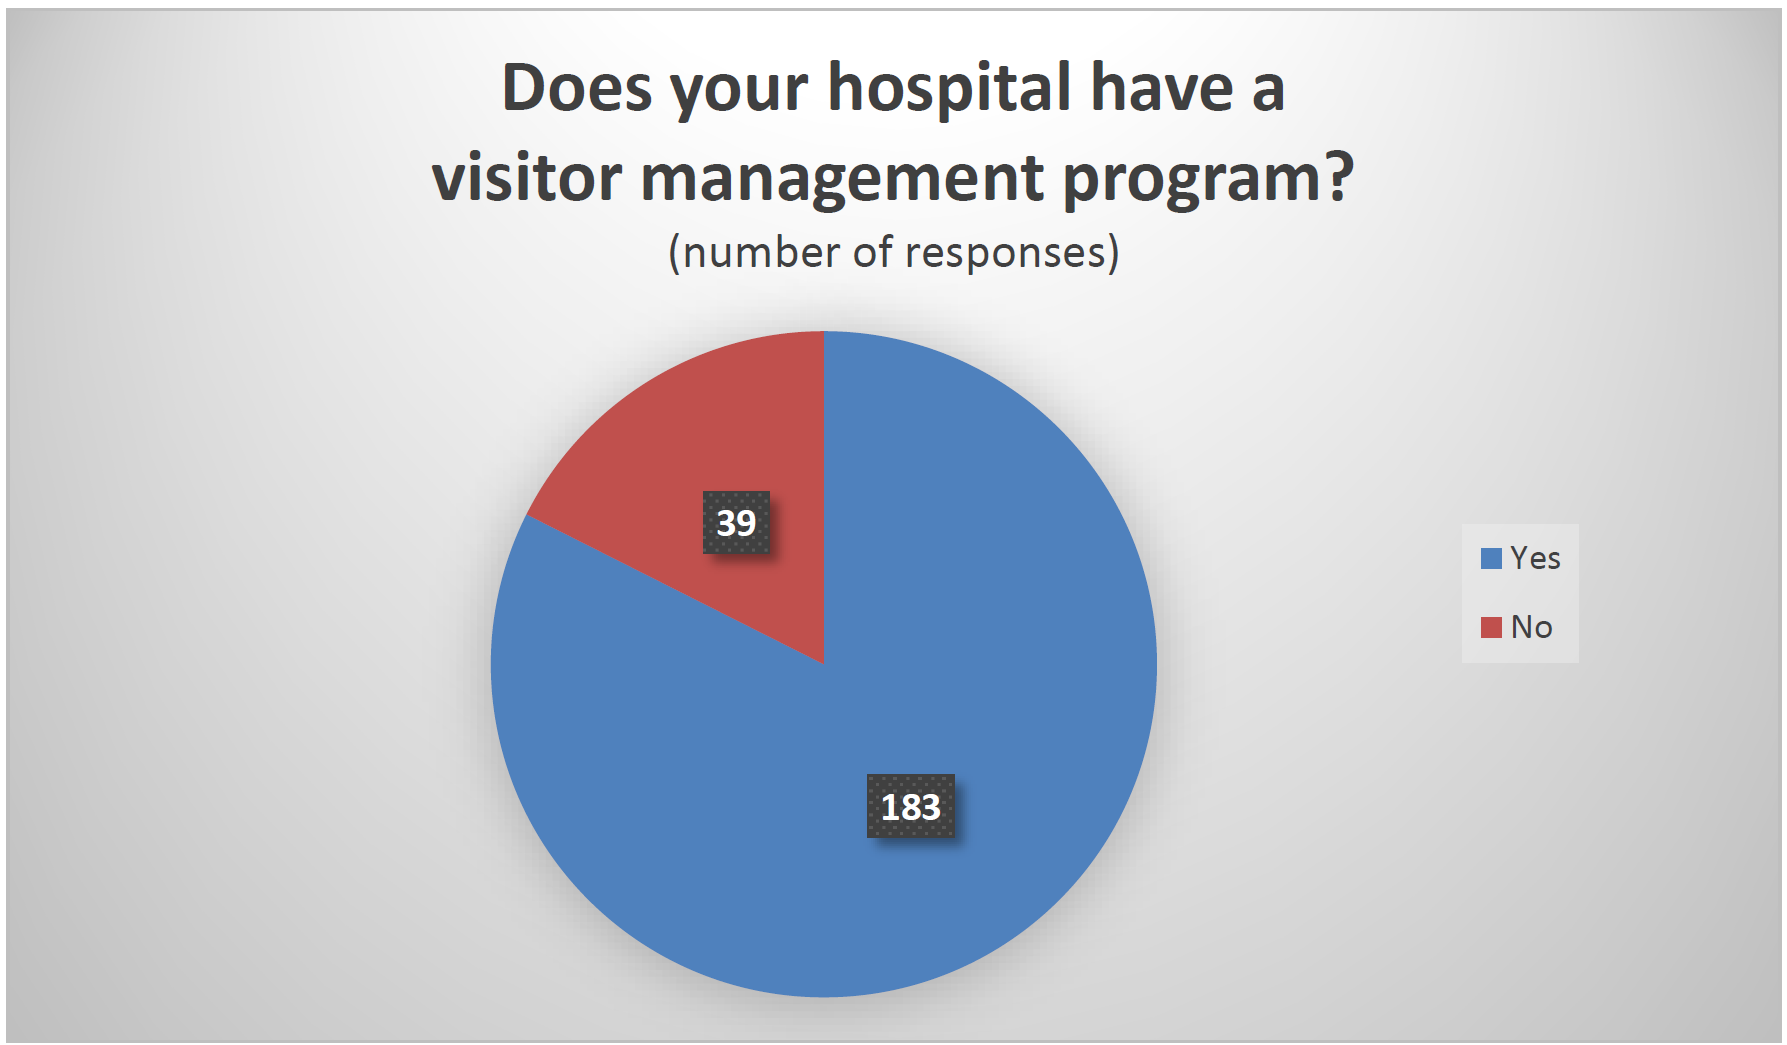
As with threat management teams, hospitals reporting the use of visitor management programs tended to be larger (320 beds and 11 full-time security employees per 100 beds vs. 272 and 9) and have higher crime rates than those reporting non-use. The violent crime rate in hospitals with visitor management programs was 2.7 incidents per 100 beds, as compared to 1.5 in those without (subtracting the effect of the previously mentioned outlier hospital, which does have a visitor management program, reduces the difference to 1.9 to 1.5), while the disorderly conduct rate was more than four times higher (65.6 vs. 14.9), the simple assault rate was nearly double (19 vs. 11.1) and the elopement rate was significantly above facilities that do not have such a program (6.6 vs. 3.8).
As with the data related to threat management teams, no conclusions should be drawn about the effectiveness of visitor management programs based on these results because, among other possibilities, hospitals facing higher rates of crime may be more likely to deploy such measures.