CRIME DATA
Raw incident numbers are of limited comparative value, given the varying sizes of hospitals across the United States. To provide context, the 2022 Healthcare Crime Survey collected bed counts for each hospital. This allowed for the calculation of crime rates (per 100 beds) and the comparison of crime rates over time.
Bed counts were selected based on experience from prior Crime Surveys in which other size and population indicators were used but were found to be more challenging to obtain. Hospitals responding to this year’s Crime Survey averaged 311 beds per facility. The survey also found that hospitals averaged 10.7 full-time security employees per 100 beds, making the average size security staff at the average size hospital a little more than 33 personnel.
This year, for the first time, the Crime Survey asked about elopements and found an average of 6.1 per 100 beds.
Readers are advised to review the Limitations section (pp. 15-16) when interpreting the data in this report.
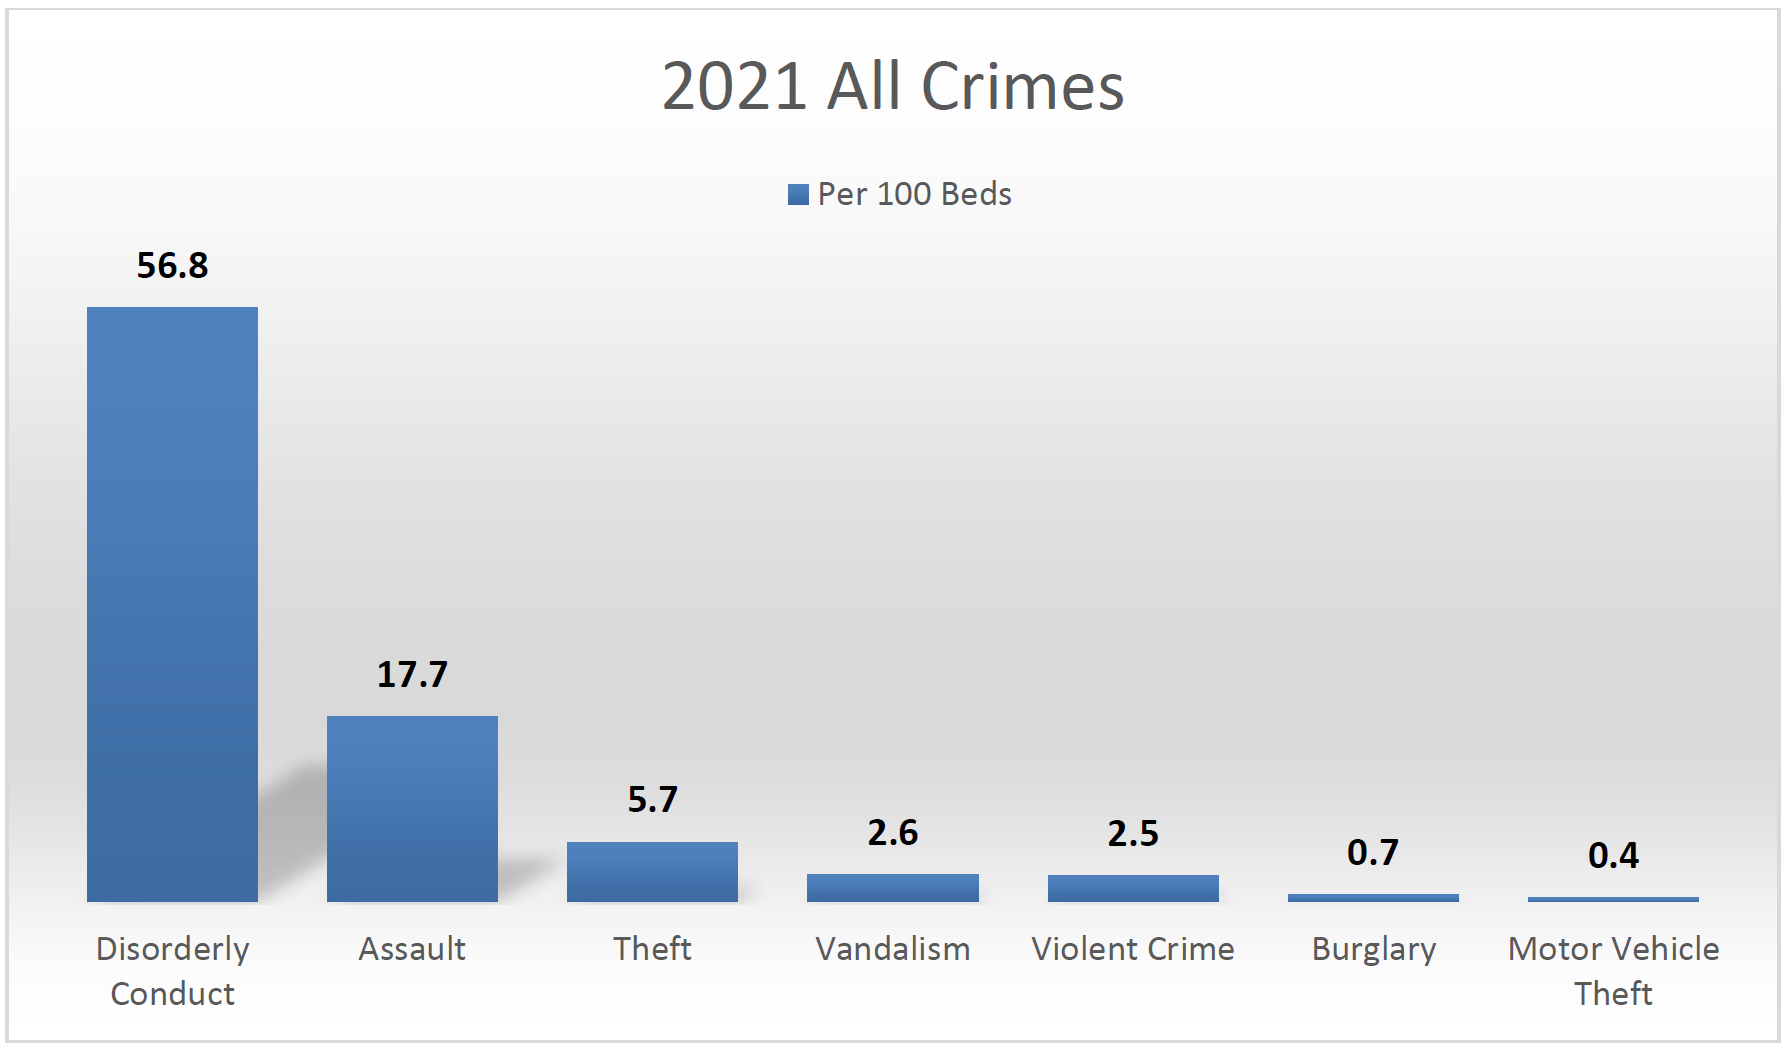
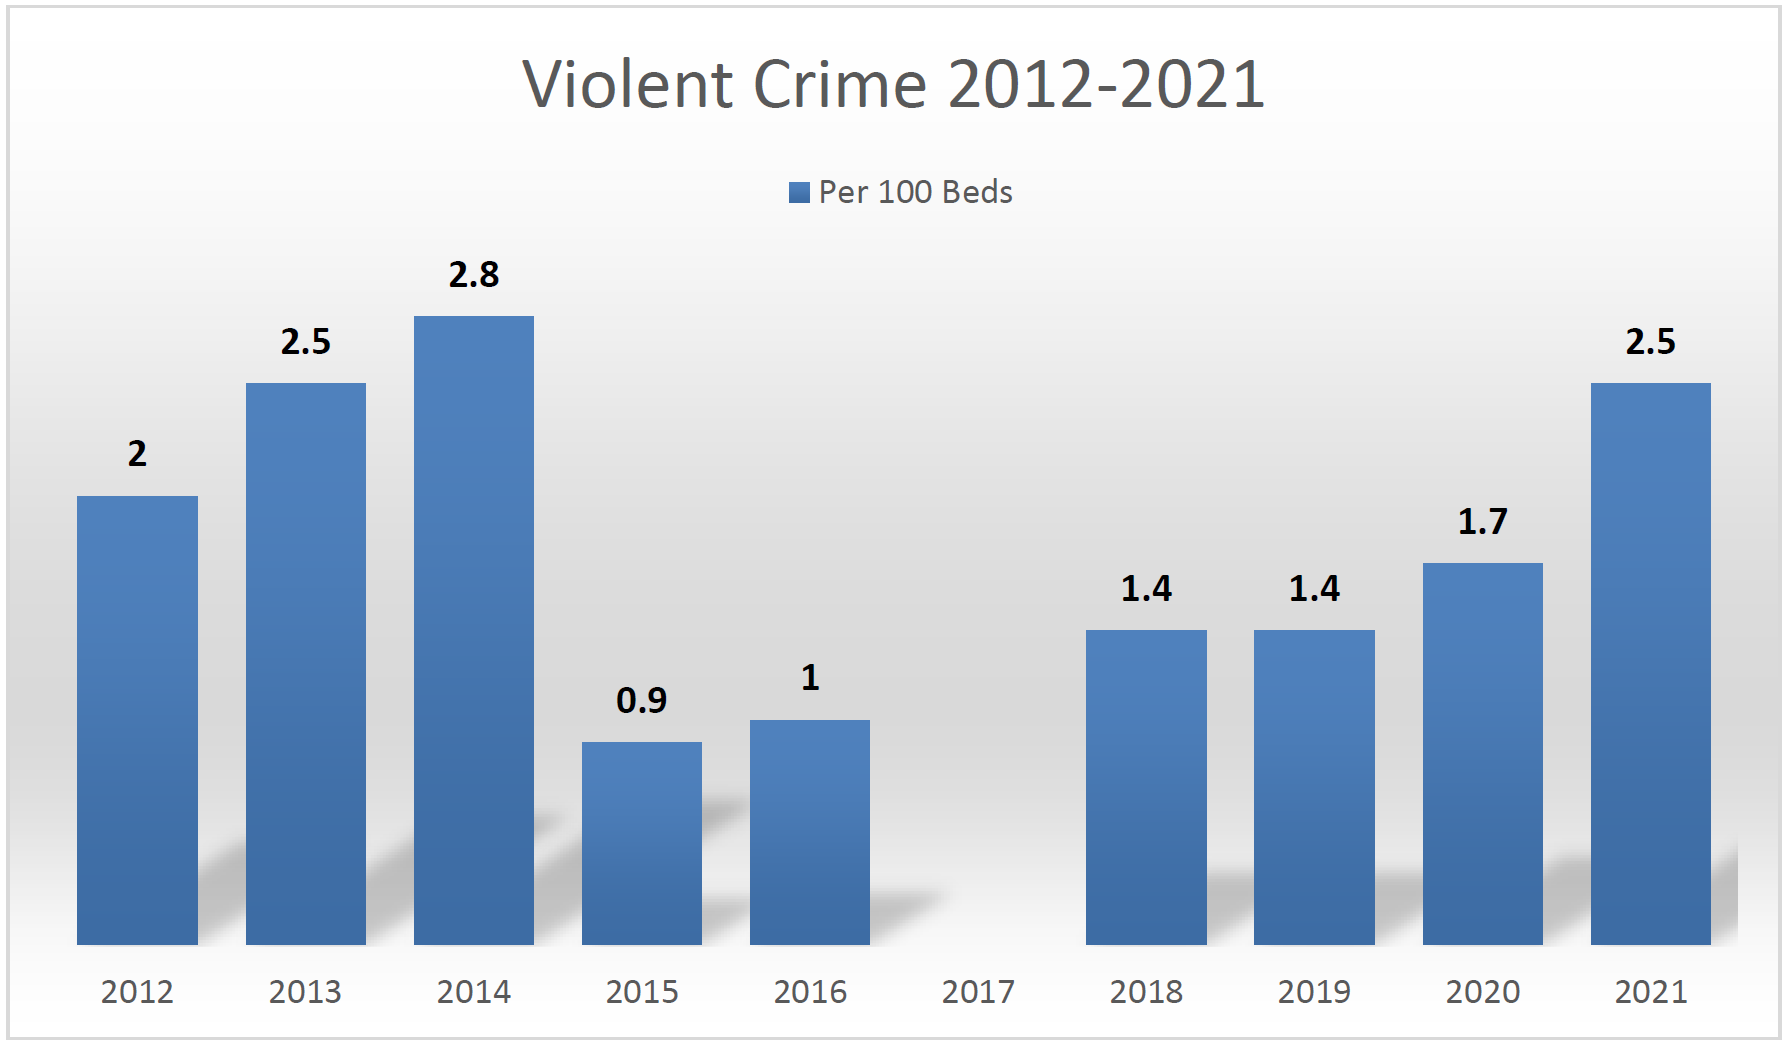
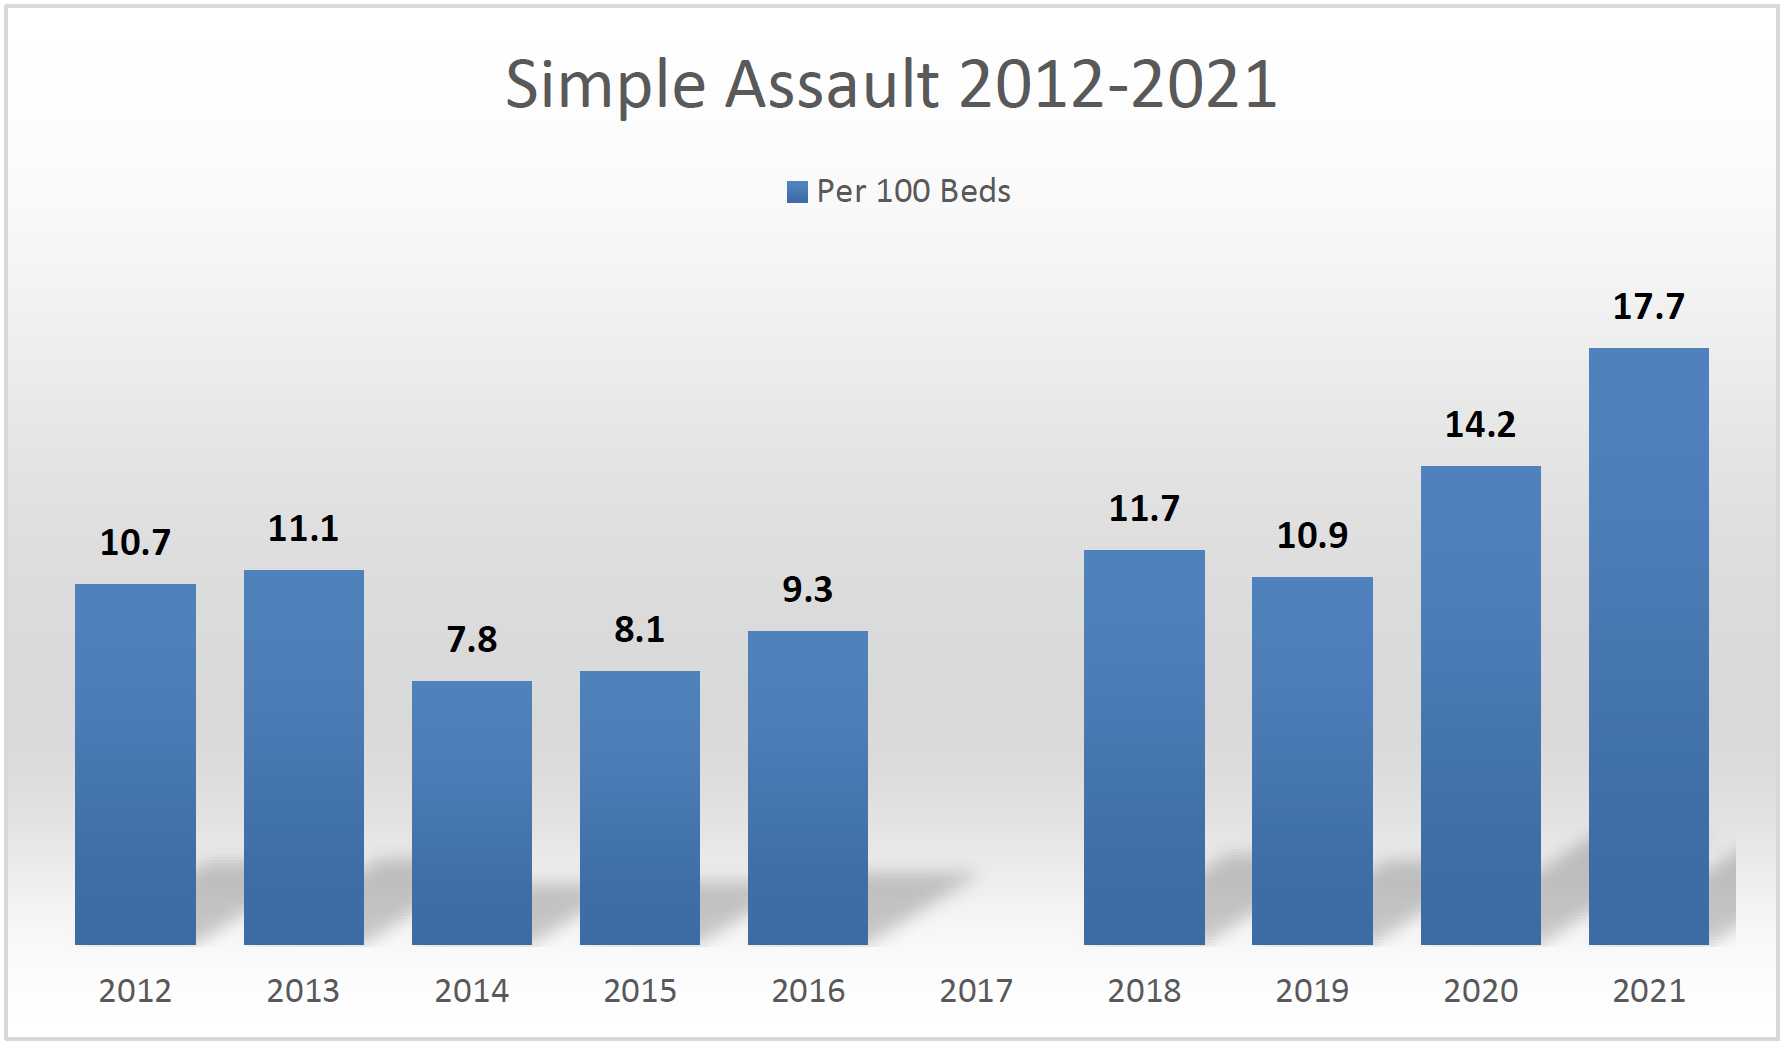
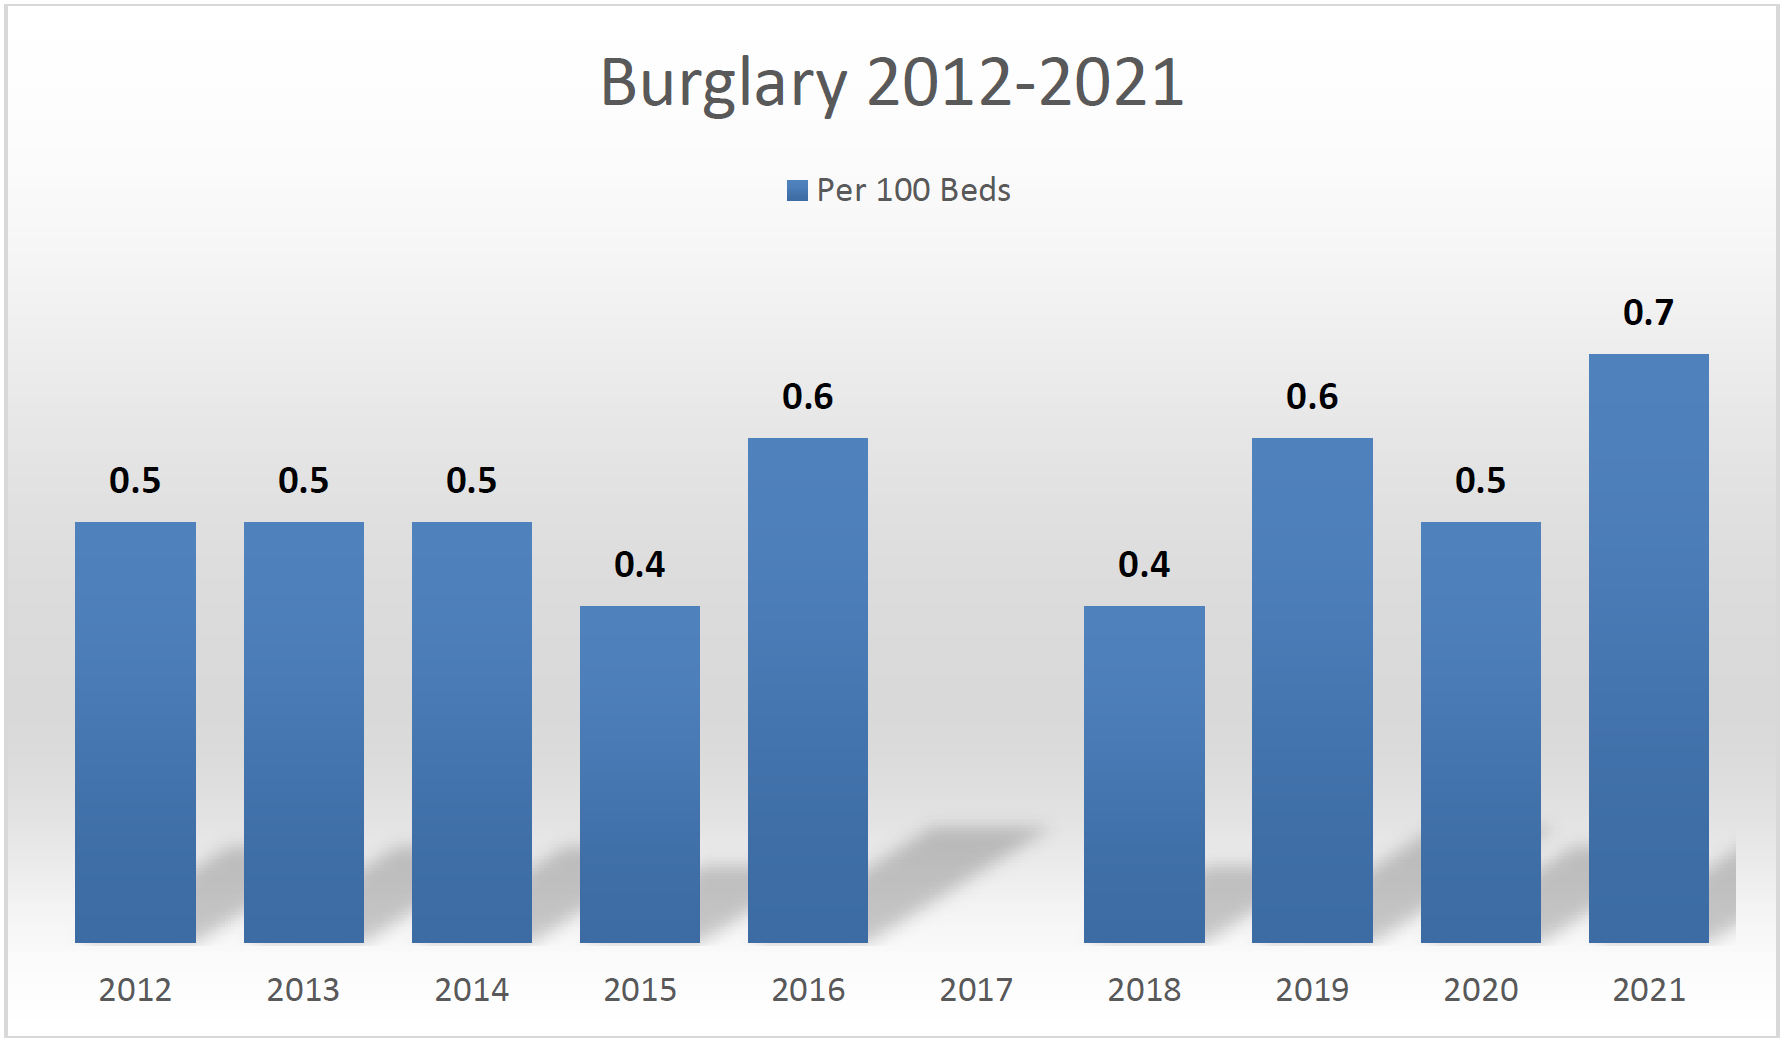
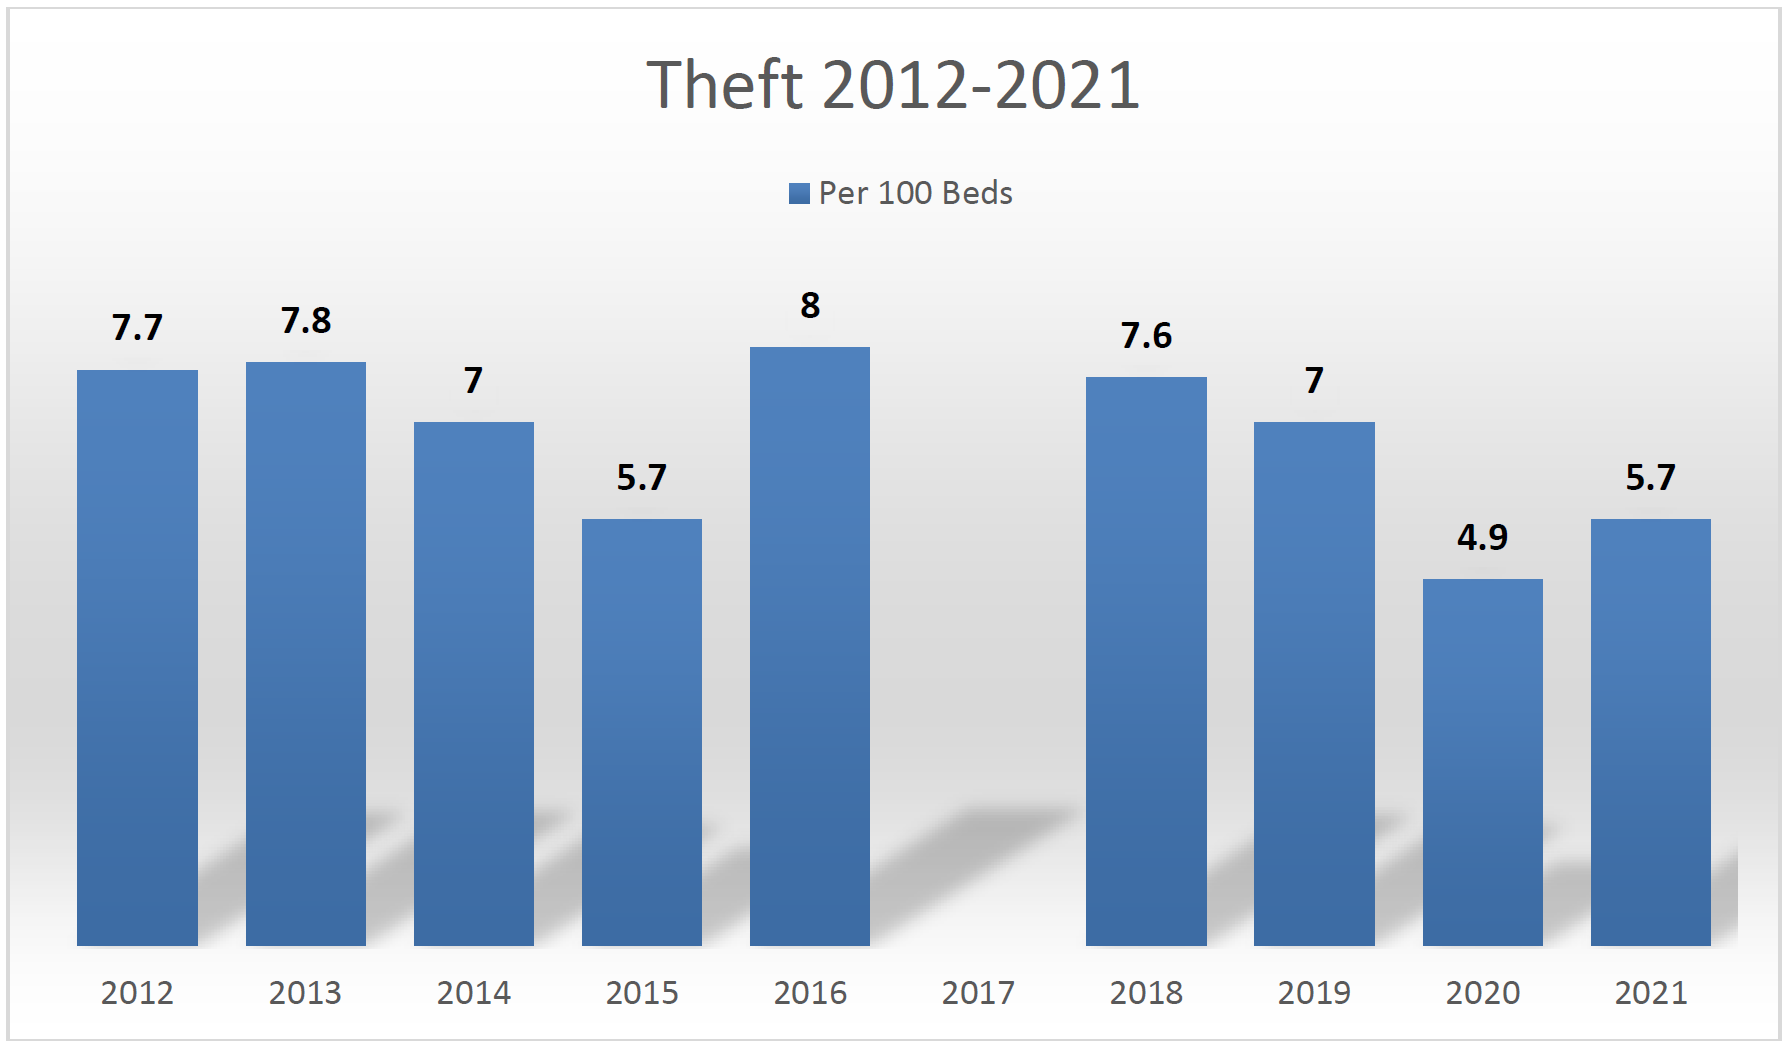
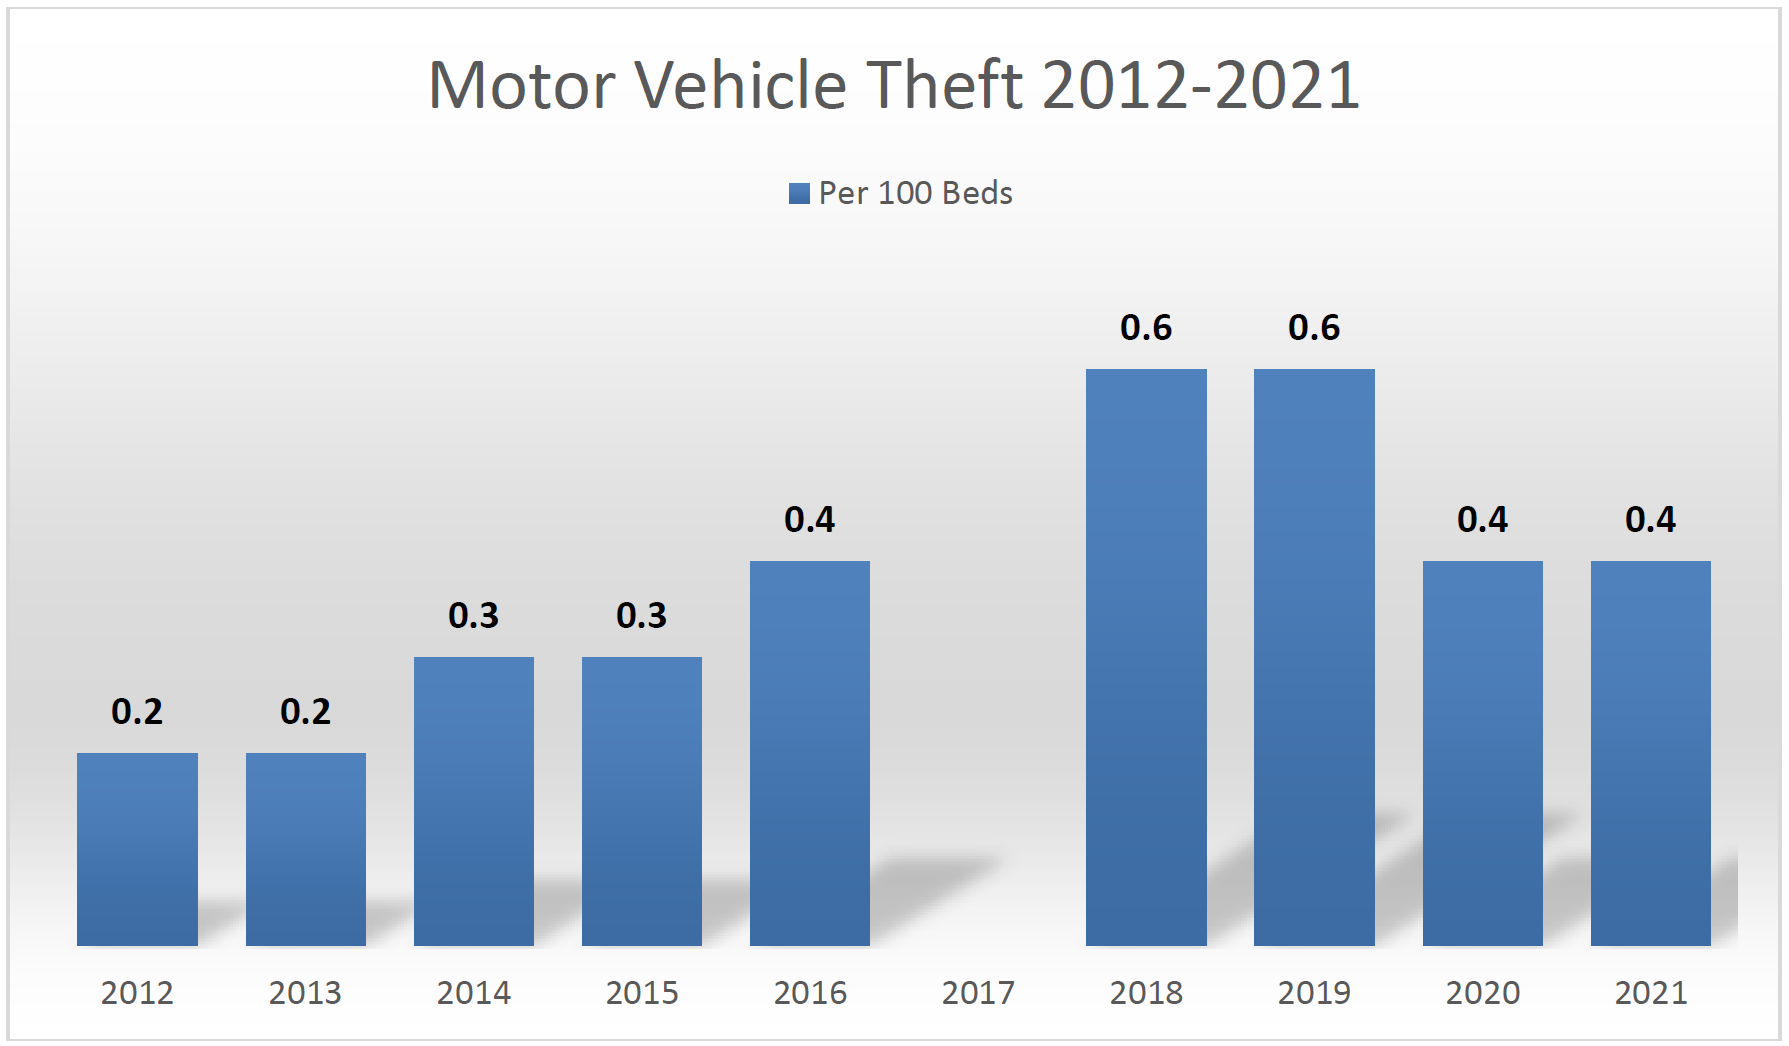
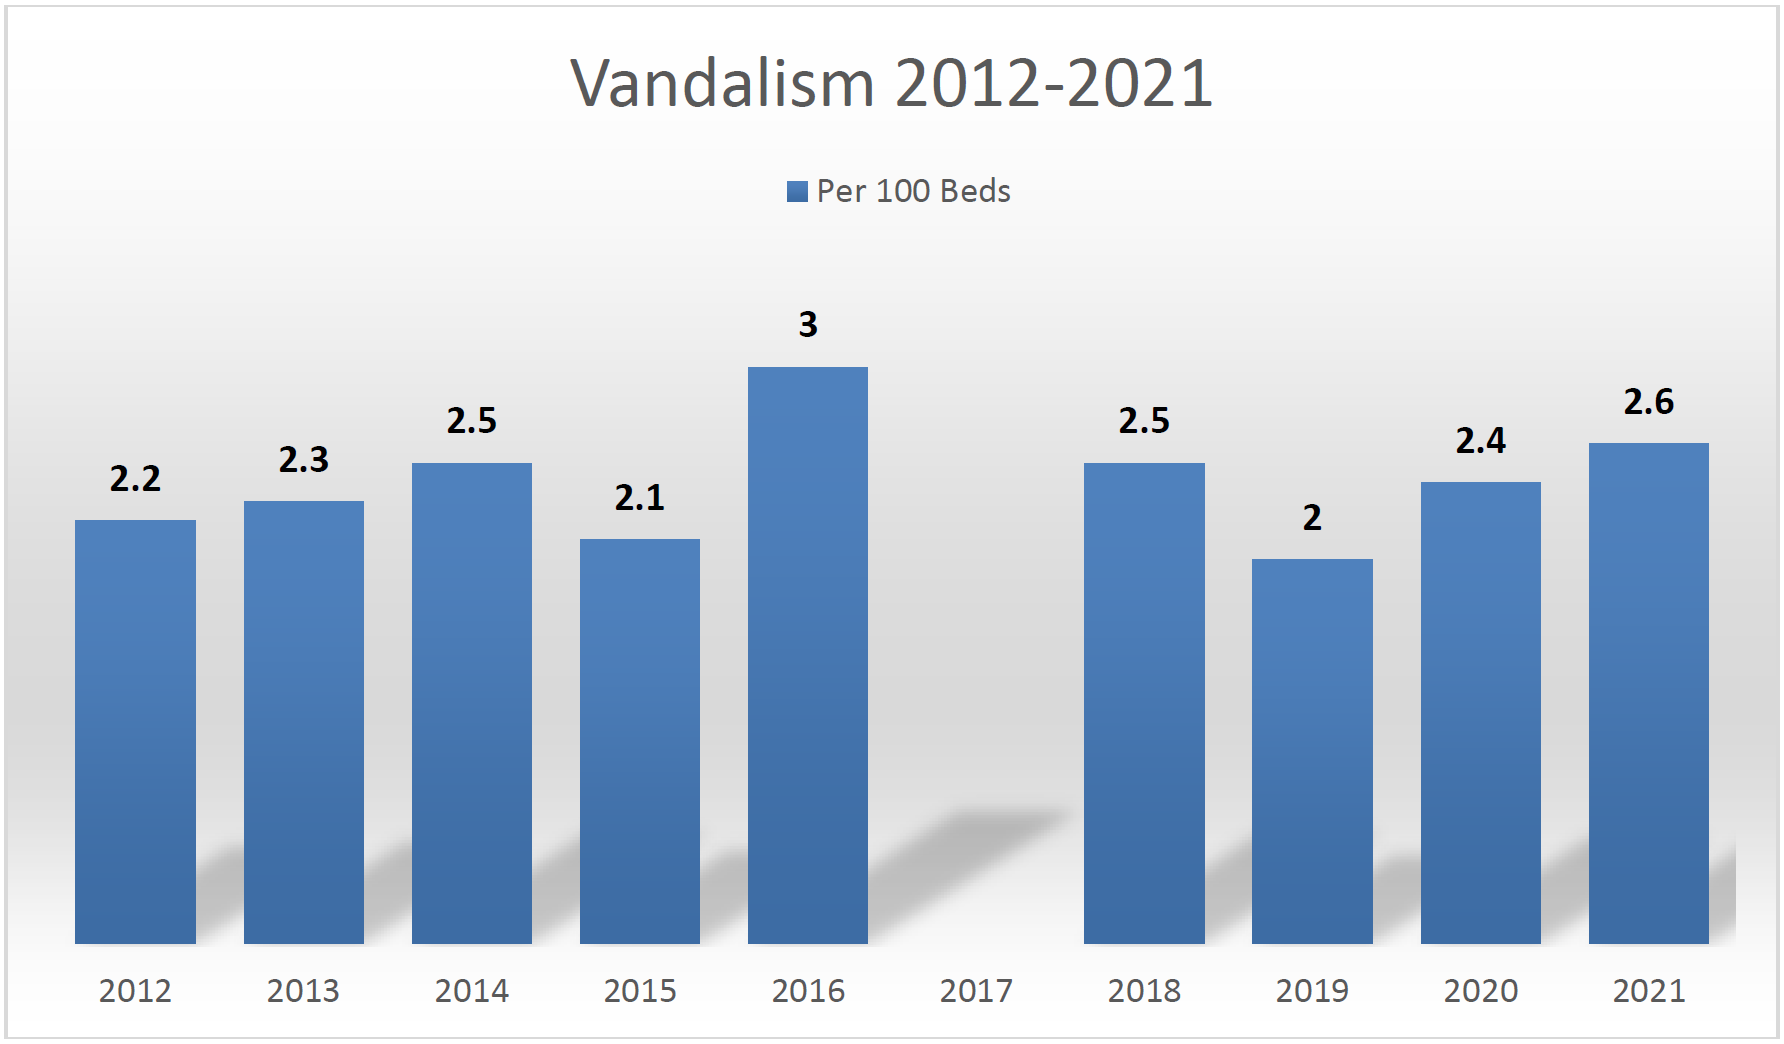
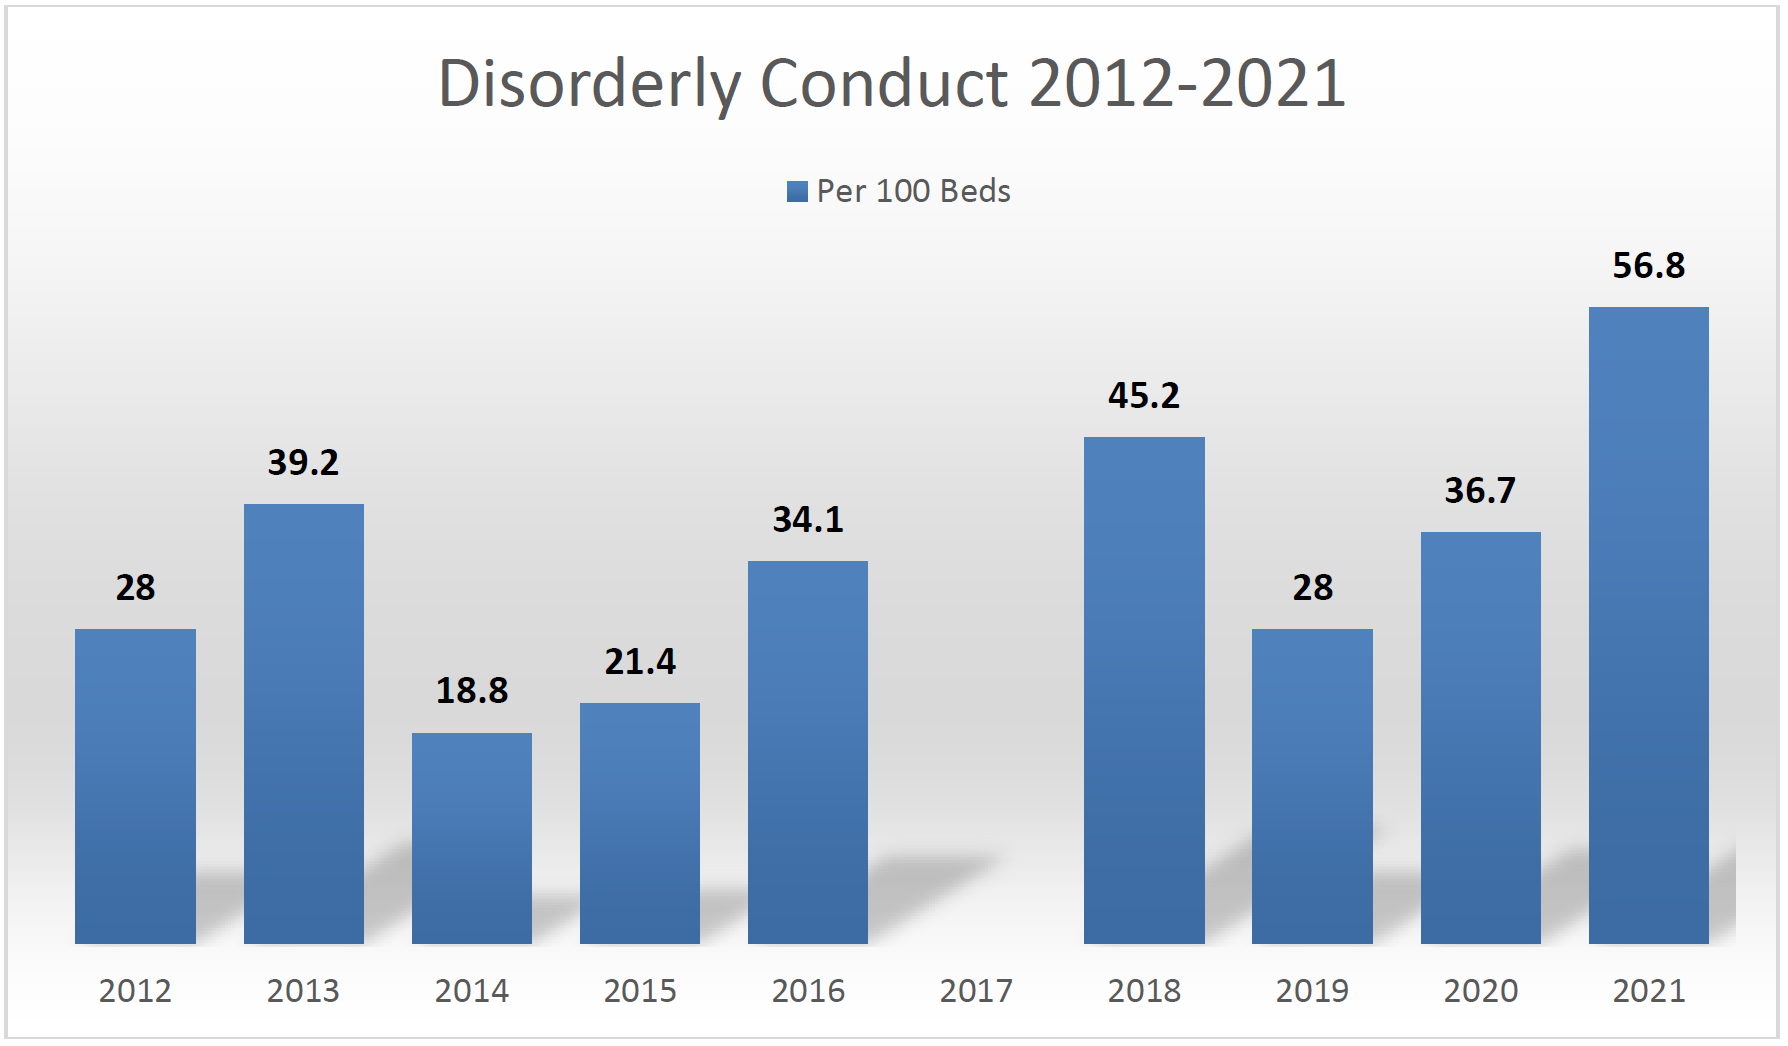
The first graph below shows the crime rates in 2021 per 100 beds for each crime. The subsequent graphs in this section display the crime rate trends from 2012 to 2021, with the exception of 2017, when no Crime Survey was published. For analytical purposes – and consistent with FBI Uniform Crime Report practice – murder, rape, robbery and aggravated assault were aggregated into one group called “violent crime.” (Aggravated assaults accounted for 85 percent of incidents in this category in 2021.)