Comparing Your Hospital to the 2017 Crime Survey
For comparison purposes, it might be beneficial to compare your hospital’s crime rates to those presented above. The formula to calculate the crime rate per 100 beds is:
Crime Rate = (x / Beds) * 100
where x is the total crime for each crime type and
Beds is the number of beds at your hospital
Example: (17 assaults / 360 beds) = 0.047 * 100 = 4.7 assaults per bed
As mentioned earlier in this report, the use of crime rates provides context and allow for comparisons to other hospitals. Bed counts were used based on experience from prior crime surveys where additional size and population indicators were collected. That experience informed the decision to use bed counts as other indicators were more challenging to obtain and not consistently reported via the crime surveys.
Workplace Violence Typology
For Aggravated Assaults and Assaults, participants were asked to drill down further, if possible, into the FBI’s workplace violence typology:
- Workplace Violence Type 1: Violent acts by criminals, who have no other connection with the workplace, but enter to commit robbery or another crime.
- Workplace Violence Type 2: Violence directed at employees by customers, clients, patients, students, inmates, or any others for whom an organization provides services.
Examples: patient-on-staff; visitor-on-staff - Workplace Violence Type 3: Violence against coworkers, supervisors, or managers by a present or former employee.
Examples: physician-on-nurse; employee-on-employee - Workplace Violence Type 4: Violence committed in the workplace by someone who doesn’t work there, but has a personal relationship with an employee—an abusive spouse or domestic partner.
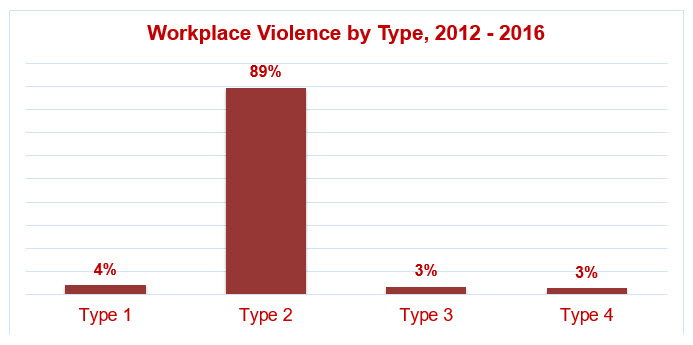
Many (n = 167) respondents provided aggravated assault and assault data by workplace violence type. As we found in prior Healthcare Crime Surveys, Workplace Violence Type 2 continues to dominate the other types of workplace violence and is increasing. Workplace Violence Type 2 aggravated assaults accounted for 85% of all aggravated assaults and 91% of all assaults in U.S. hospitals. For simplicity, the graph below displays each Workplace Violence Type with aggravated assaults and assaults combined.
To drill down on Workplace Violence Type 2 incidents, we asked respondents (n = 83) two additional questions this year. The first question asked: “If an Assault against a Healthcare Provider is a crime in your state, how many people were charged with this crime in your healthcare facility in 2016?” For this analysis, we used responses that had at least one charge as a result of a “Assault on Healthcare Worker” law. This was a form of data validation wherein hospitals were excluded if they responded with 0 (zero) charges as we were concerned that internal policies may discourage staff from pressing charges on patients or visitors for assaults. For hospitals that had at least one charge under an existing “Assault on Healthcare Worker” law, 15% of Workplace Violence Type 2 incidents (assault or aggravated assault by a patient or visitor) resulted in a charge in 2016.
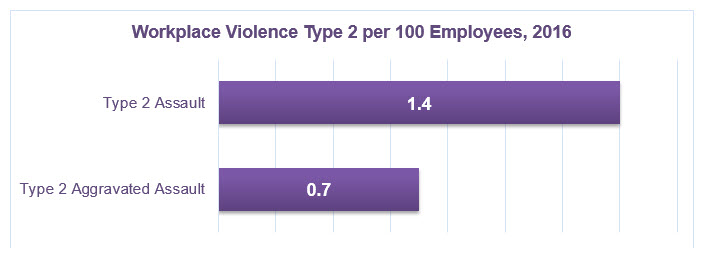
The second question asked how many employees worked at the hospital. The responses (n = 160) to this question allowed us to calculate the number of Workplace Violence Type 2 incidents per 100 employees. Since this question is unique for this year’s Healthcare Crime Survey, the graph below displays the 2016 rate of assaults and aggravated assaults against employees by patients or visitors per 100 employees.