
Comparing Your Hospital
To compare your hospital’s crime rate to the statistics above, the following formula can be used to calculate the rate per 100 beds:
Crime Rate = (x / Beds) * 100
where x is the total crime for each crime type and
Beds is the number of beds at your hospital
Example: (17 assaults / 360 beds) = 0.047 * 100 = 4.7 assaults per 100 beds
WORKPLACE VIOLENCE TYPOLOGY
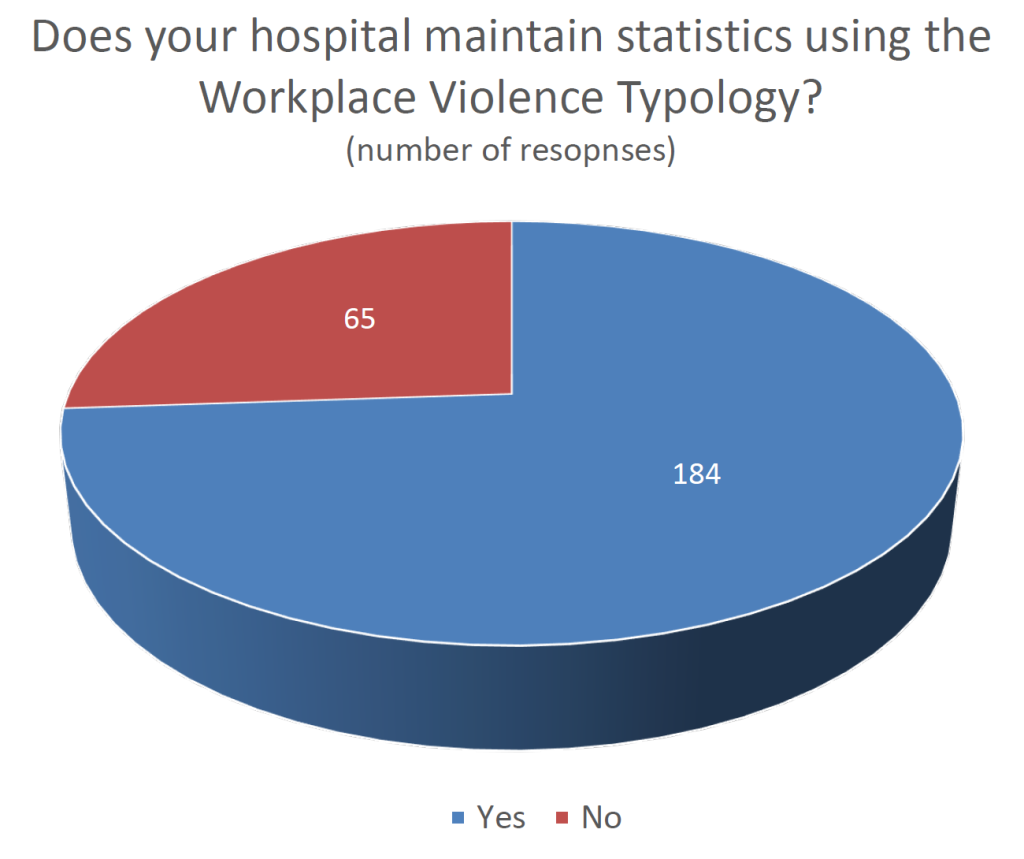
To drill down further into the assault numbers, we asked if hospitals maintain statistics using the Workplace Violence Typology. This classifies both aggravated assaults and simple assaults into four types.
- Workplace Violence Type 1: Violent acts by criminals, who have no other connection with the workplace, but enter to commit robbery or another crime
- Workplace Violence Type 2: Violence directed at employees by customers, clients, patients, students, inmates or any others for whom an organization provides services
- Workplace Violence Type 3: Violence against coworkers, supervisors or managers by a present or former employee
- Workplace Violence Type 4: Violence committed in the workplace by someone who does not work there but has a personal relationship with an employee, e.g., an abusive spouse or domestic partner
Of 249 responses, 74 percent said their hospitals use this typology. In the previous survey, 71 percent reported using it.
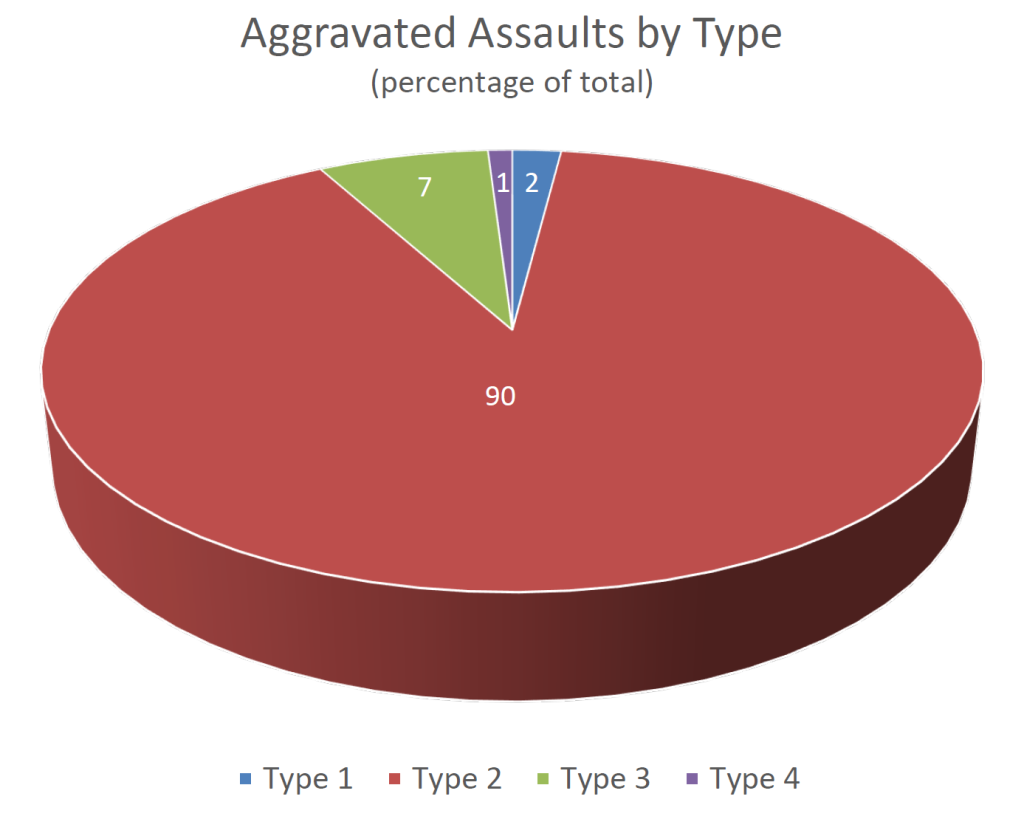
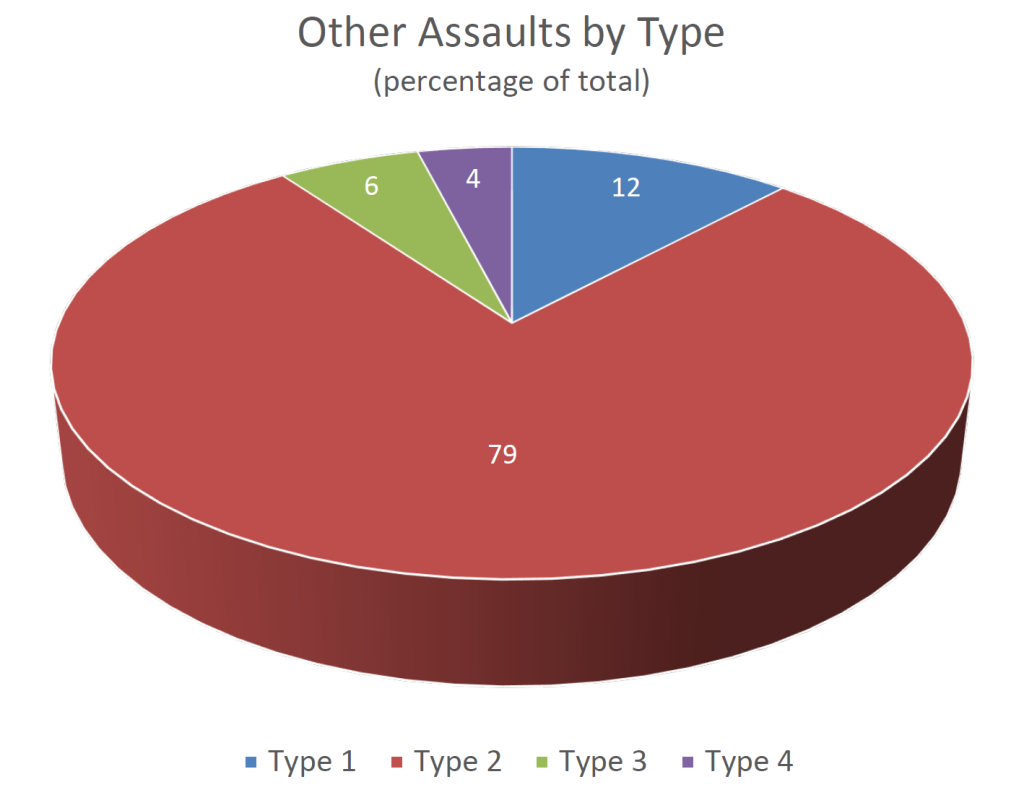
Among those reporting assaults by category, type 2 (violence directed at employees by nonemployees) attacks were, by far, the most common, accounting for 83 percent of aggravated assaults and 93 percent of simple assaults. In 2021, the results were 73 percent and 86 percent, respectively.
ADDITIONAL QUESTIONS
In addition to inquiring about crime data, we asked respondents questions regarding specific aspects of their security operations.
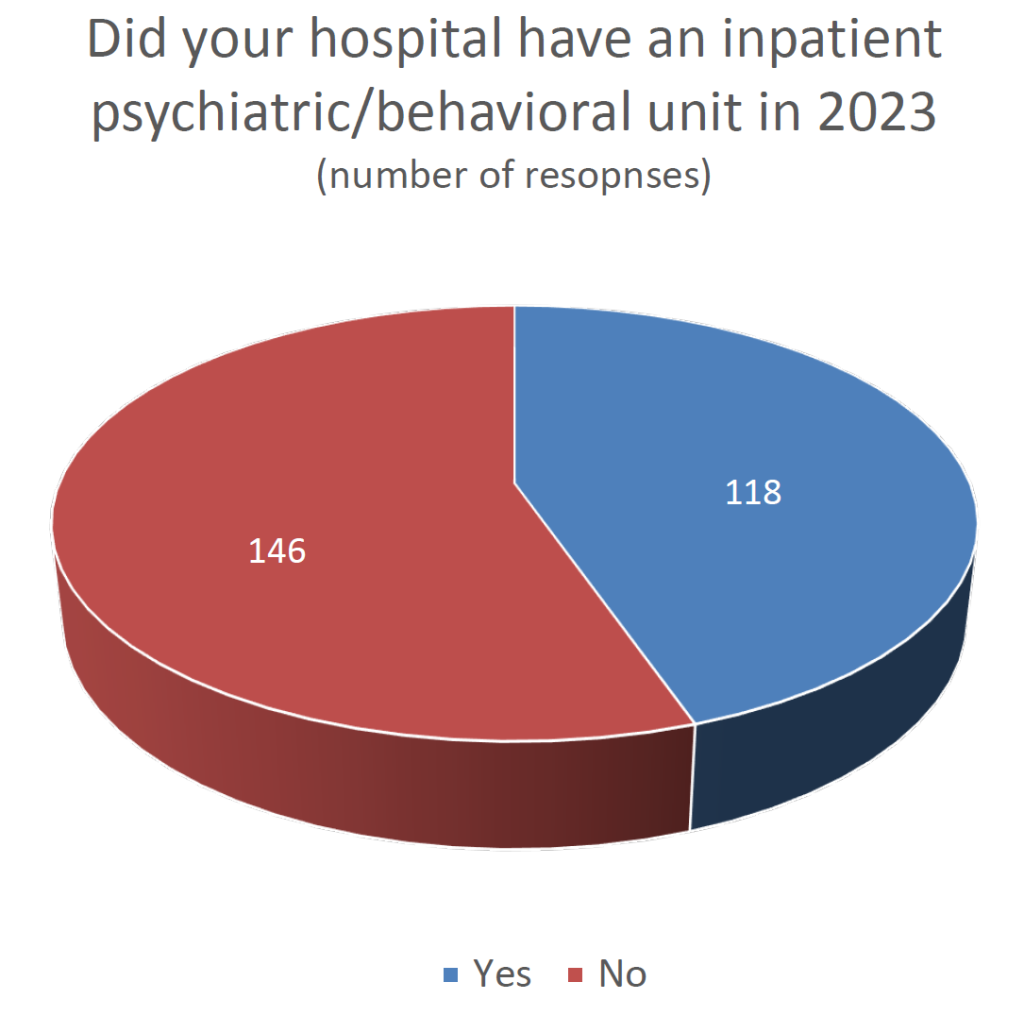
Inpatient Psychiatric/Behavioral Unit
We asked if responding facilities had an inpatient psychiatric/behavioral unit. Of the 264 that provided an answer, 45 percent said yes. In the previous survey, 42 percent said yes.
Respondents with psychiatric/behavioral units tended to be much larger than those without such units, with an average of 408 beds per facility compared to 221.
Hospitals with these units had somewhat higher rates of disorderly conduct and other assaults, but they had a lower violent crime rate (1.7 incidents per 100 beds vs. 2.3 incidents per 100 beds among facilities without them). Certain data limitations should be noted here, however. Two respondents that do not have in-patient psychiatric units reported a high number of aggravated assaults (totaling 277 between them), which was enough to raise the incidents per 100 beds rate for the csategory by 0.9, from 1.4 to 2.3.
Threat Management Teams
We asked respondents if their hospital uses threat management teams in security operations.
Although the term was not defined in the survey, a threat management team, generally speaking, is a tool aimed at reducing workplace violence by bringing together individuals from various departments within an organization to assess threats, develop countermeasures, and intervene before violence occurs. Of 249 responses, 60 percent said they use threat management teams. In the previous survey, 64 percent reported using such teams.
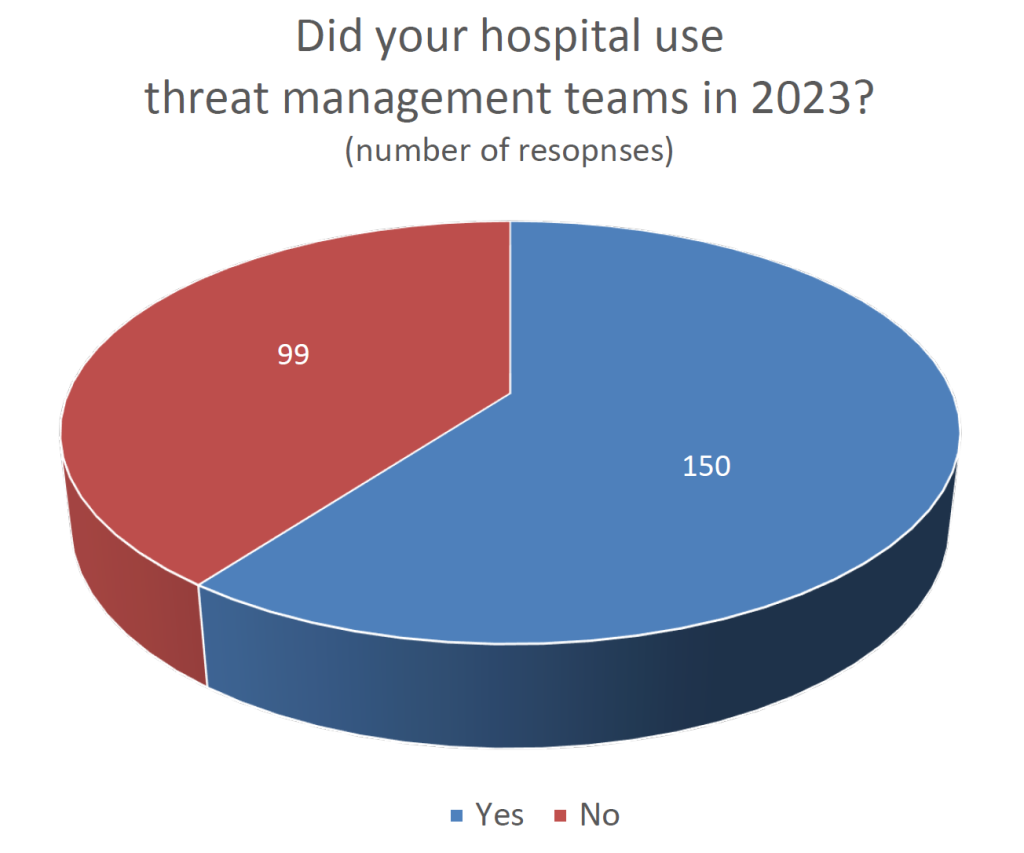
Facilities reporting that they use threat management teams tended to be larger in terms of both bed count and security staff (averaging 343 beds and 10.8 full-time security staff per 100 beds) than those without such teams (which average 252 beds and 9.2 full-time security staff per 100 beds.)
Compared to facilities without threat management teams, hospitals with them had higher incidents of violent crime (2.1 per 100 beds vs 1.5 per 100 beds) and disorderly conduct (65.6 compared to 47.3). As noted in previous years, though, this may be because hospitals facing greater risks and higher rates of crime are more likely to implement threat management teams and other enhanced security measures.
Visitor Management Programs
We asked if hospitals used visitor management programs to track entry and exit to and from their facilities by people other than staff and patients. Of 259 responses, 58 percent said yes. In the previous survey, 61 percent reported having such programs in place.
Hospitals
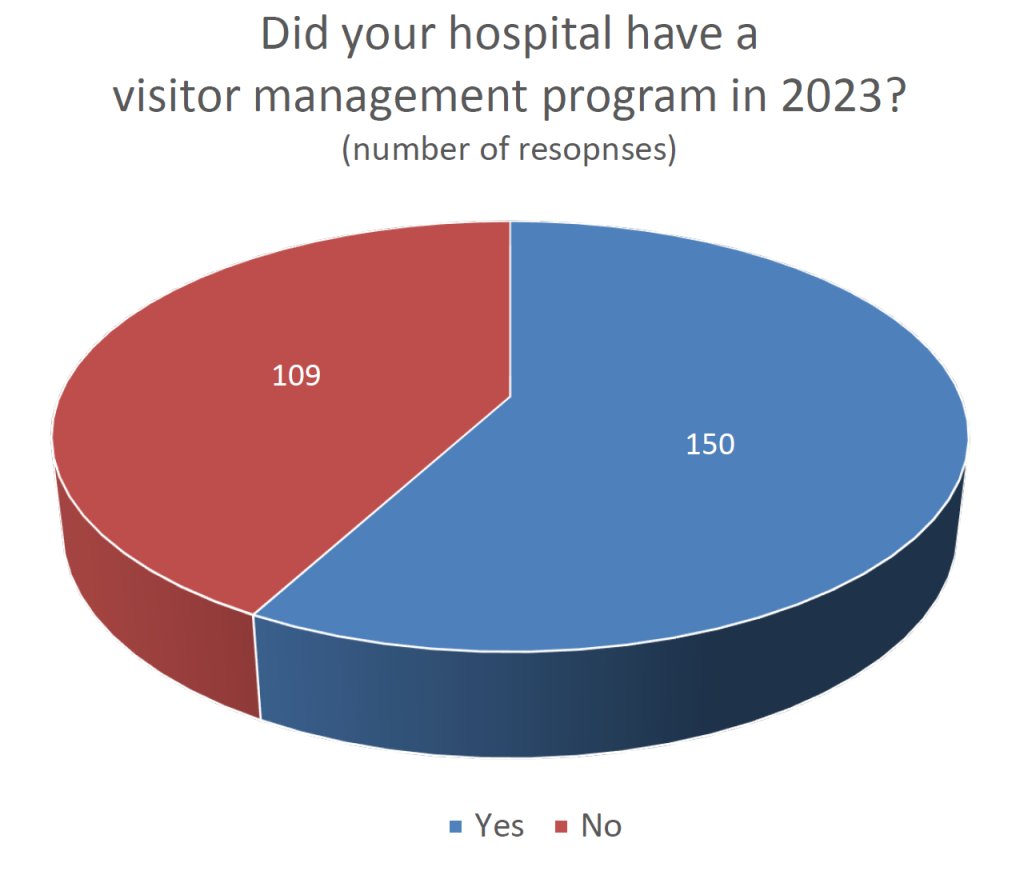
Hospitals with visitor management programs tended to be bigger facilities with larger security staffs, averaging 366 beds and 10.9 full-time security staff per 100 beds, while hospitals without such programs averaged 221 beds and 8.5 security staff per 100 beds.
Crime rates were similar between the two categories, though hospitals that did not have a visitor management program had a higher rate of elopements (10.4 per 100 beds compared to 6.6 per 100 beds).
Recruiting and Retaining Security Staff
We asked respondents to gauge the difficulty of recruiting and retaining a full, qualified security staff. Of 262 responses, 56 percent reported experiencing varying degrees of difficulty in filling their security staff, while 13 percent reported relative ease. Last year, the respective percentages were 65 and 13.
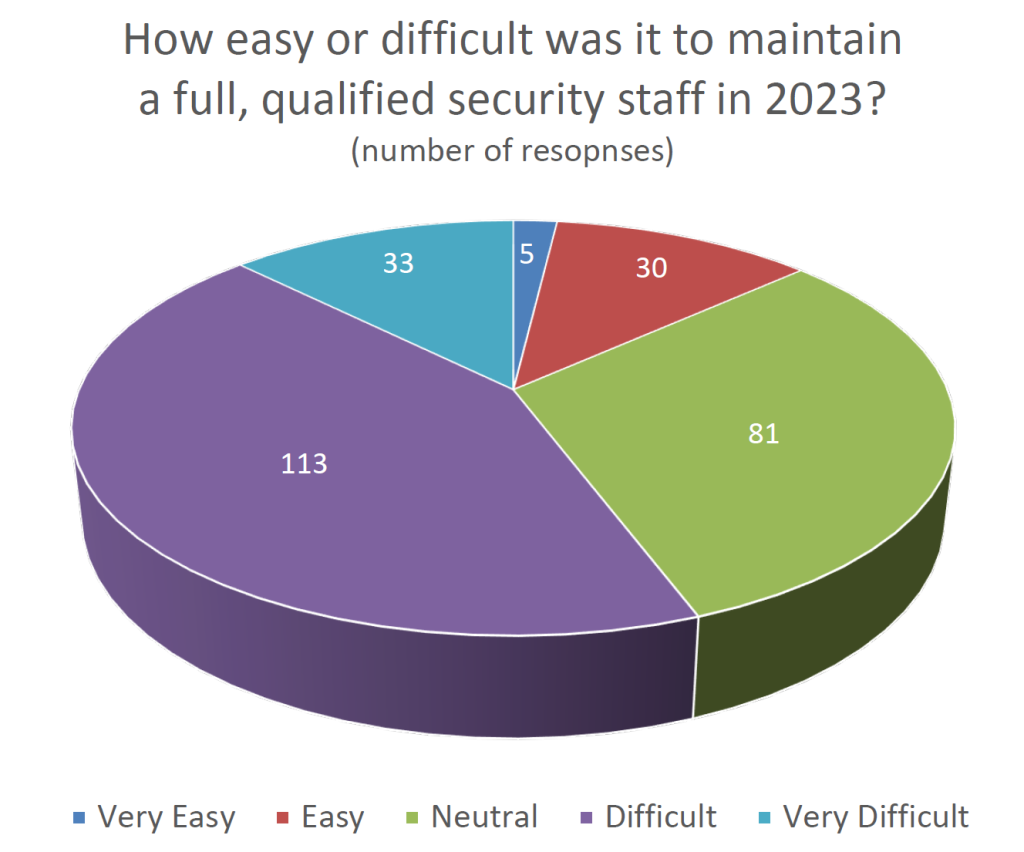
Hospitals reporting that it was “Difficult” or “Very Difficult” tended to be larger than those reporting having an “Easy” or “Very Easy” time, with an average of 359 beds per facility compared to 232.