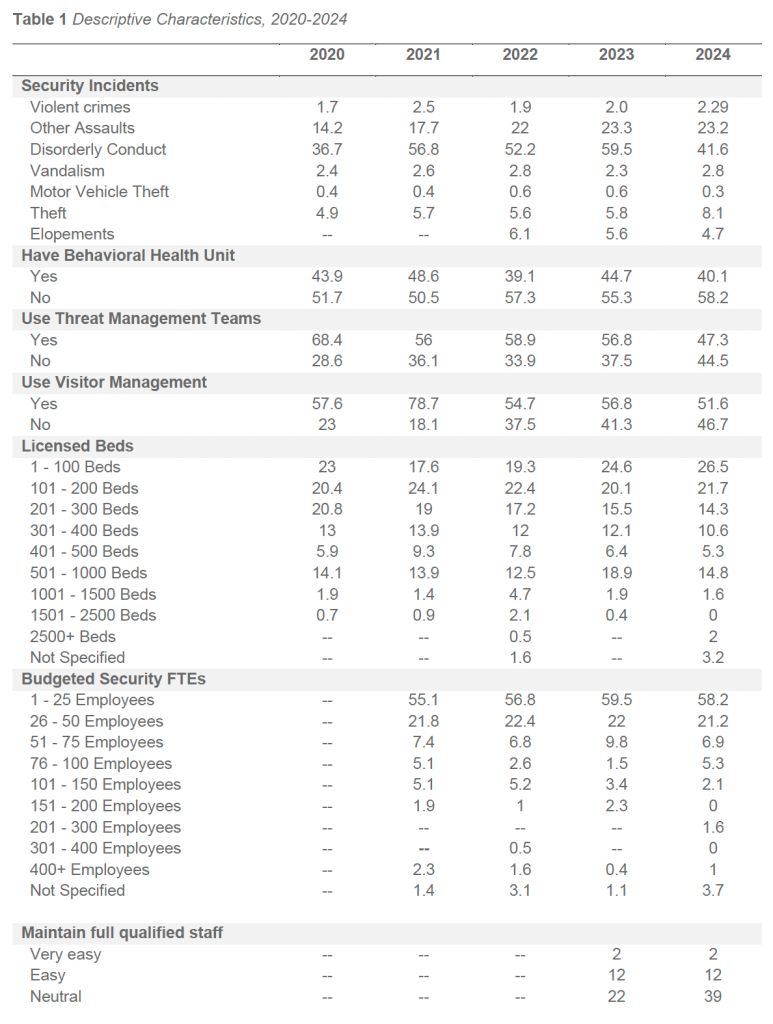
Of responding facilities in 2024, 40.1 percent reported operating an inpatient psychiatric or behavioral health unit. This proportion is consistent with historical survey results, which have typically ranged between approximately 39 and 50 percent across prior survey cycles, indicating stable representation of inpatient BH services among participating facilities.
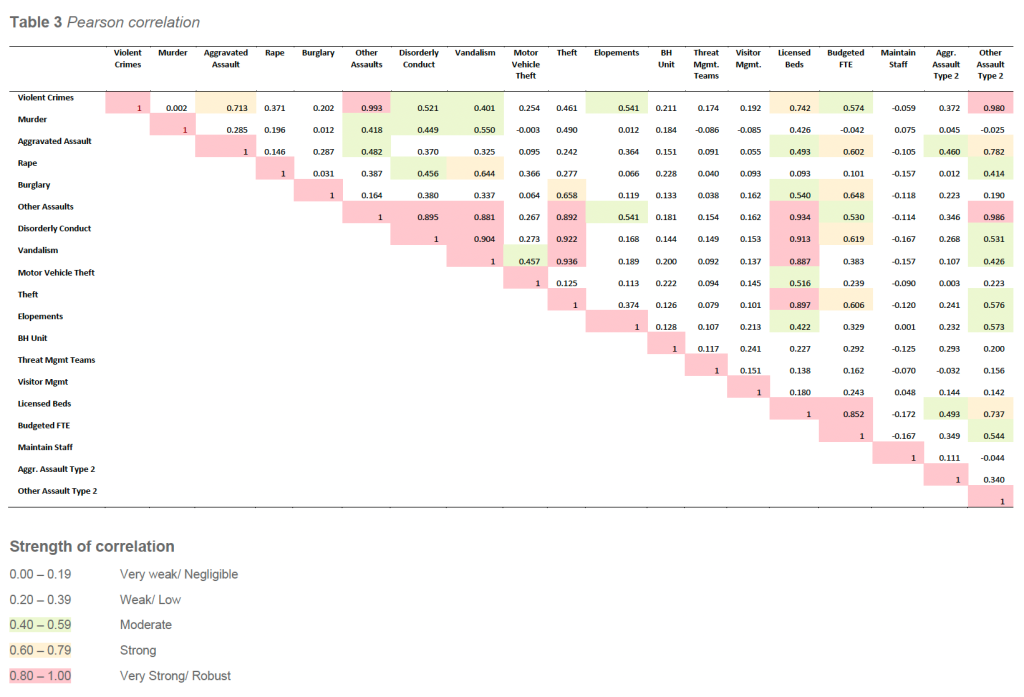
Correlation analysis of the 2024 dataset indicates that facilities with inpatient BH units tend to operate within more complex clinical and operational environments. Facilities with BH units demonstrated a modest positive correlation with security staffing levels (r = 0.29) and licensed bed count (r = 0.23). While these correlations are not strong, they reinforce that facilities operating BH units often require expanded security resources to support higher behavioral acuity, increased incident exposure, and more frequent crisis-driven interactions.
Importantly, the relatively weak correlation with bed size confirms that elevated WPV and behavioral risk in BH-unit facilities is driven more by patient population complexity and service mix than by facility size alone. This finding is consistent with IAHSS guidance emphasizing that security risk in behavioral health environments is not adequately explained by census or square footage metrics in isolation.
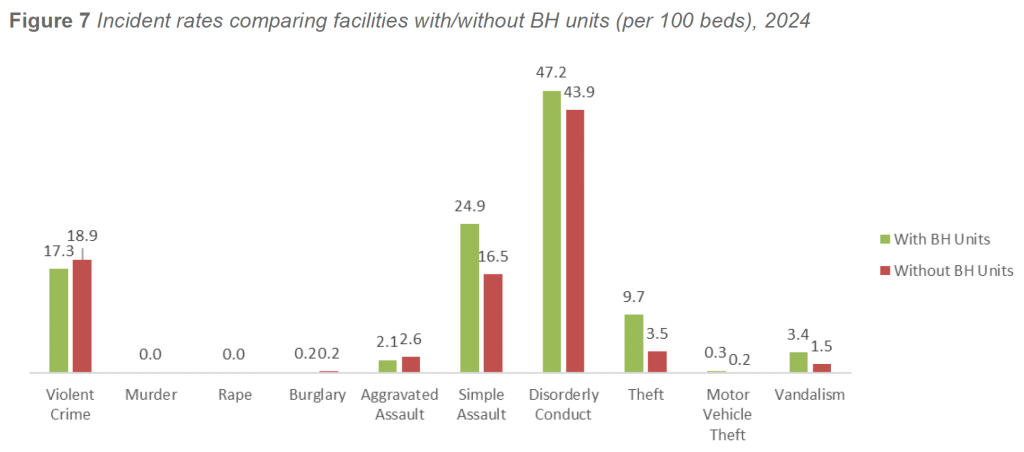
In 2024, facilities with inpatient BH units continued to demonstrate elevated rates of behavior-driven incidents across multiple categories. After excluding zero-bed facilities and adjusting for statistical outliers, violent crime rates averaged 17.3 incidents per 100 beds in facilities with BH units, compared with 18.9 incidents per 100 beds in facilities without BH units. Aggravated assault rates followed a similar pattern, with facilities without BH units reporting higher rates than facilities with BH units (2.6 versus 2.1 incidents per 100 beds, respectively).
A different pattern emerged across other behaviorally linked categories. Disorderly conduct was reported at higher rates in facilities with BH units, averaging 47.2 incidents per 100 beds, compared with 43.9 incidents per 100 beds in facilities without BH units. Simple assaults were also more prevalent in BH-unit facilities, averaging 24.9 incidents per 100 beds, compared with 16.5 incidents per 100 beds in facilities without BH units.
Adjusted rates for additional behaviorally associated categories remained higher in facilities with BH units. Theft averaged 9.7 incidents per 100 beds in facilities with BH units, compared with 3.5 incidents per 100 beds in facilities without BH units. Vandalism followed a similar pattern, with BH-unit facilities reporting 3.4 incidents per 100 beds, compared with 1.5 incidents per 100 beds in non-BH facilities.
These patterns suggest that while facilities without BH units may experience higher rates of certain violent outcomes—particularly aggravated assaults—facilities with BH units carry a consistently higher burden of behavioral escalation, interpersonal aggression, and ancillary crime categories tied to the intensity and volatility of behavioral health care environments.
Summary and Implications
The presence of an inpatient psychiatric or behavioral health unit remains one of the most consistent predictors of elevated behavioral incident exposure across healthcare facilities. Even after adjusting for zero-bed facilities, statistical outliers, and weighted bed distribution, facilities with BH units experience higher rates of simple assault, disorderly conduct, and other behaviorally linked incidents than facilities without such units.
Consistent with IAHSS Healthcare Security Industry Guidelines, these patterns reflect risks that are structural and clinically driven, rather than artifacts of reporting practices or facility size. While a small number of high-acuity facilities exert upward pressure on certain raw incident rates, adjusted analyses confirm that underlying behavioral risk remains materially higher in environments providing inpatient psychiatric care.
Taken together, the 2024 findings and historical survey data reinforce the need for enhanced security staffing models, interdisciplinary behavioral response strategies, advanced de-escalation capabilities, and targeted environmental controls in facilities operating inpatient behavioral health units. These facilities will continue to require elevated levels of operational readiness and tailored security resources to safely manage the complex behavioral dynamics inherent in this patient population.
Patient Elopements
Patient elopement remains a critical safety and security concern due to the potential for patient harm, regulatory exposure, and resource-intensive response requirements. The 2024 survey examined patient elopement rates in facilities with and without BH units, using both bed-normalized and security staffing– normalized rates to support meaningful comparison.
This analysis aligns with IAHSS Healthcare Security Industry Guideline 05.05 Patient Elopement Prevention and Response, which emphasizes standardized definitions, consistent incident reporting, and the use of normalized metrics to evaluate elopement risk and prevention effectiveness.
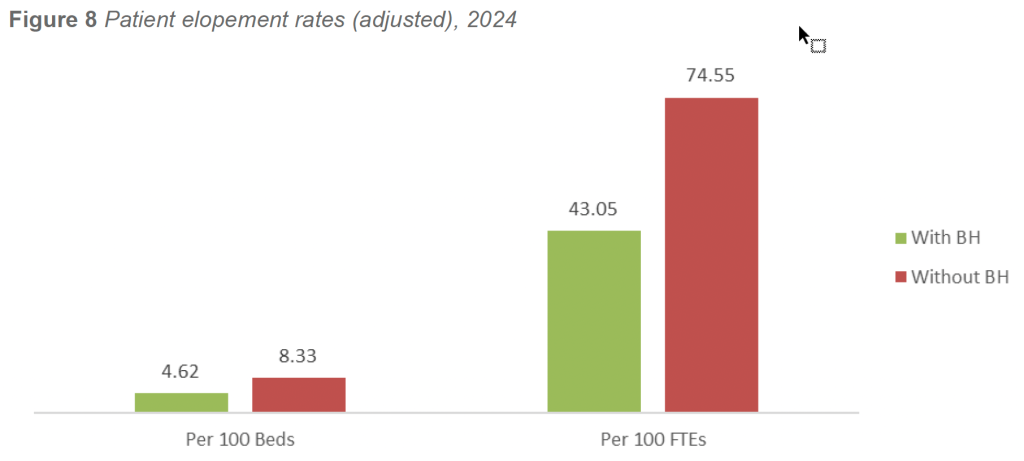
In 2024, facilities with inpatient BH units reported lower elopement rates than facilities without BH units across both measurement methods. When normalized per 100 licensed beds, facilities with BH units reported 4.62 elopements per 100 beds, compared with 8.33 elopements per 100 beds in facilities without BH units.
A similar pattern was observed when rates were normalized per 100 security FTE personnel. Facilities with BH units reported 43.05 elopements per 100 security FTEs, compared with 74.55 elopements per 100 security FTEs in facilities without BH units. The consistency of this pattern across denominators reinforces the validity of the finding and minimizes the influence of facility size or staffing variability.
Despite caring for some of the highest-risk patient populations, facilities operating inpatient BH units consistently demonstrate lower elopement exposure. This outcome reflects the structural and operational characteristics of dedicated behavioral health environments, which commonly include secured or semisecured unit design, controlled ingress and egress, ligature-resistant architecture, enhanced patient observation protocols, and staff competencies centered on behavioral risk recognition and crisis intervention.
In contrast, facilities without dedicated BH units frequently manage behaviorally complex or psychiatric patients in emergency departments, medical-surgical units, or temporary holding areas. These environments are often characterized by open layouts, competing clinical priorities, higher patient throughput, variable staffing levels, and limited environmental controls. Extended boarding of psychiatric patients while awaiting placement further elevates elopement risk in these settings.
Summary and Implications
Across multiple survey years, measurement methods, and denominators, the presence of inpatient behavioral health infrastructure functions as a reliable protective factor against patient elopement. Facilities with BH units consistently outperform facilities without such units, despite managing higheracuity patient populations.
These findings reinforce the importance of purpose-built environments, trained staff, and structured behavioral care protocols in reducing unauthorized patient departures. Consistent with IAHSS guidance, effective elopement prevention is not driven solely by staffing levels or surveillance, but by the integration of environmental design, clinical collaboration, clear response procedures, and disciplined incident reporting.
Taken together, the 2024 results and historical trend data confirm that investments in inpatient behavioral health infrastructure and elopement prevention programs produce measurable safety benefits. Facilities without BH units may need to prioritize interim mitigation strategies—such as enhanced observation, environmental controls, and multidisciplinary response protocols—when managing high-risk behavioral patients outside of dedicated behavioral health settings.
Threat Management Teams
Threat Management Teams (TMTs) represent a core organizational strategy for identifying, assessing, and managing threats of violence and other behaviors of concern within healthcare environments. The 2024 survey examined the prevalence of TMT adoption and compared incident rates between facilities with and without a formal Threat Management Team.
This analysis aligns with IAHSS Healthcare Security Industry Guideline 01.09.03 Threat Management, which emphasizes multidisciplinary threat assessment, early identification of concerning behaviors, and coordinated intervention, as well as Guideline 01.05 Program Measurement and Improvement, which supports the use of incident data to evaluate program effectiveness and guide resource allocation.
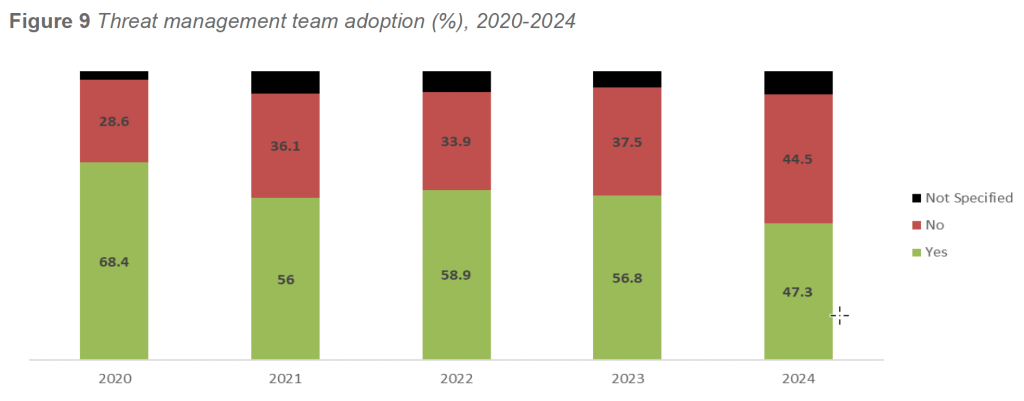
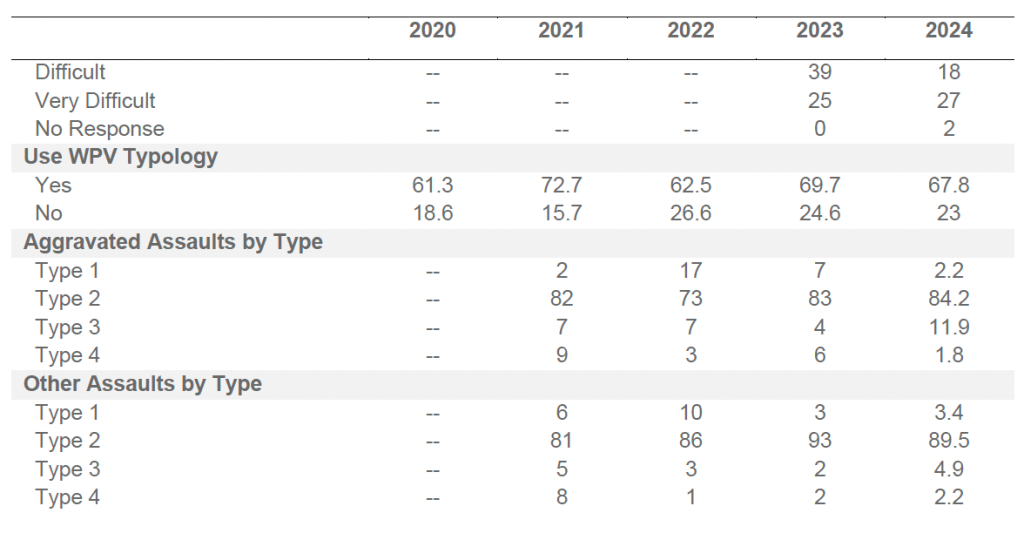
In 2024, 47.3 percent of responding facilities reported having a Threat Management Team in place. This represents a decline from 2023 (56.8 percent) but remains consistent with longer-term adoption patterns observed across prior survey cycles. As in previous years, TMT adoption was most common among facilities with larger campuses, higher behavioral acuity, and more complex operational environments.
Since 2020, TMT adoption has fluctuated but generally remained between 47 and 68 percent of responding facilities. The highest reported adoption occurred in 2020 (68.4 percent), followed by gradual declines through 2024. A small proportion of facilities each year continued to report TMT status as “Not Specified” (approximately 5–8 percent). These patterns suggest that while TMTs are now well-established in many organizations, sustained adoption may be influenced by staffing capacity, leadership turnover, and competing operational priorities.
Weighted analysis of 2024 incident data indicates that facilities with Threat Management Teams reported higher overall incident rates than facilities without TMTs. Facilities with TMTs averaged 98.8 incidents per 100 beds, compared with 42.6 incidents per 100 beds in facilities without TMTs.
When incident rates were normalized by staffing levels, the same pattern persisted. Facilities with TMTs reported higher incidents per 100 security FTEs than facilities without TMTs, reflecting the combined effects of larger security departments, higher incident exposure, and more comprehensive reporting practices.
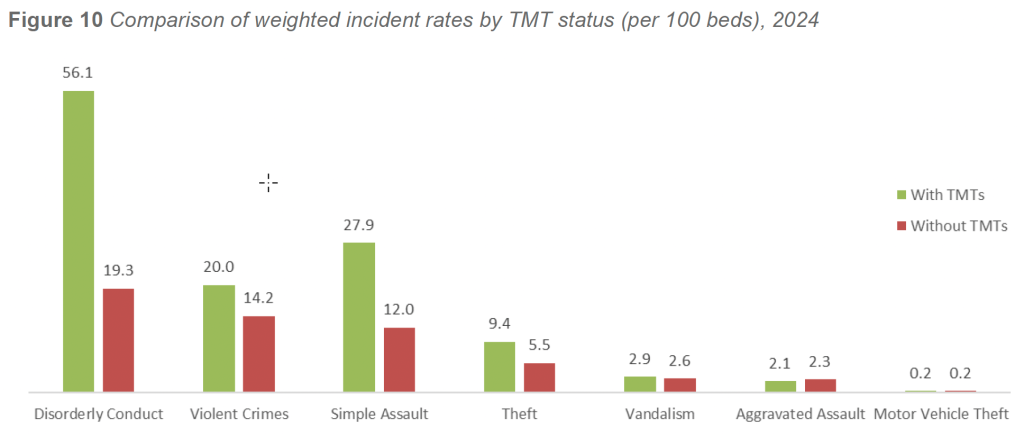
A more detailed review of 2024 incident categories further illustrates these differences. Facilities with TMTs reported higher rates of:
- Simple assault (27.9 per 100 beds, compared with 12.0 per 100 beds in non-TMT facilities)
- Disorderly conduct (56.1 versus 19.3 per 100 beds)
- Theft (9.4 versus 5.5 per 100 beds)
- Vandalism (2.9 versus 2.6 per 100 beds)
Overall violent crime rates were also higher in facilities with TMTs, averaging 20.0 incidents per 100 beds, compared with 14.2 incidents per 100 beds in facilities without TMTs.
These differences are consistent with patterns observed across multiple survey years and reflect the broader operational footprint of TMT-enabled facilities. Facilities with TMTs are more likely to be larger, higher-acuity organizations with behavioral health services, elevated public interface, and mature security reporting infrastructures.
Summary and Implications
The presence of a TMT should not be interpreted as an indicator of increased violence. Rather, TMT adoption is a marker of organizational maturity, risk awareness, and reporting fidelity. Facilities with TMTs consistently document higher incident volumes because they operate in more complex environments and possess the governance structures necessary to identify, evaluate, and record behaviors of concern before they escalate into severe outcomes.
Consistent with IAHSS guidance, TMTs serve a critical role in healthcare environments by supporting multidisciplinary collaboration, structured threat assessment, early intervention, and coordinated response. Their prevalence among facilities with the highest behavioral and interpersonal risk reinforces their relevance as a foundational component of modern WPV prevention and behavioral risk management programs.
Taken together, the 2024 findings and historical survey data reaffirm that TMTs are most commonly implemented where they are needed most—within facilities facing elevated behavioral complexity, greater public exposure, and higher overall incident burden. Their continued adoption remains an essential strategy for improving threat visibility, strengthening prevention efforts, and supporting safer healthcare environments.
Visitor Management Programs
Visitor Management Programs (VMS) represent a foundational element of access control and public interface management within healthcare environments. The 2024 survey examined the prevalence of VMS adoption and compared incident rates between facilities with and without a formal visitor management system.
This analysis aligns with IAHSS Healthcare Security Industry Guidelines 04.03 Access Control and 01.05 Program Measurement and Improvement, which emphasize structured visitor control, credentialing, and the use of incident data to evaluate program effectiveness and inform risk mitigation strategies.
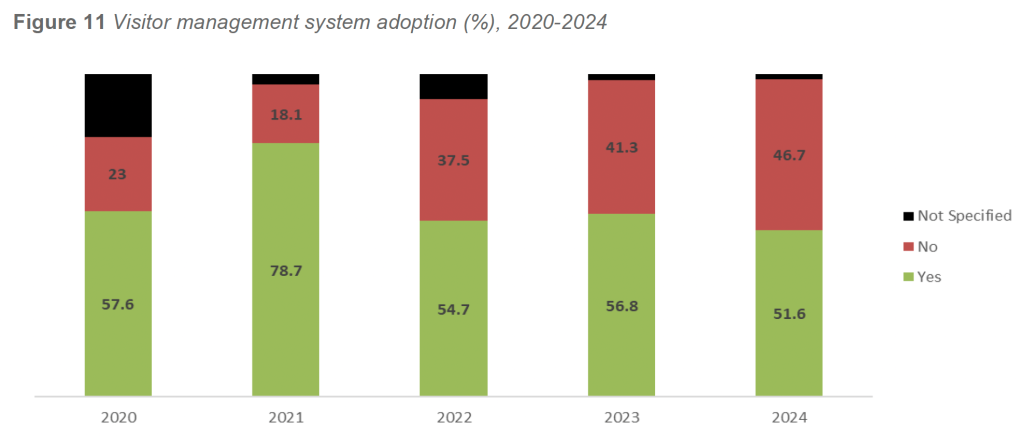
In 2024, 51.6 percent of responding facilities reported operating a formal Visitor Management Program, while 46.7 percent reported no such program in place. This represents a modest decline from 2023 (56.8 percent) but remains consistent with the stabilization observed following several years of adoption growth. VMS implementation continues to be most common among larger facilities, urban campuses, and regional health systems with high daily visitor volumes and complex access control requirements.
Historical adoption trends between 2020 and 2024 demonstrate moderate variability. Adoption peaked in 2021 at 78.7 percent before stabilizing in a range of approximately 51 to 57 percent in subsequent years. A small proportion of facilities each year continued to report VMS status as “Not Specified” (approximately 5–8 percent), suggesting ongoing variability in program definition or reporting.
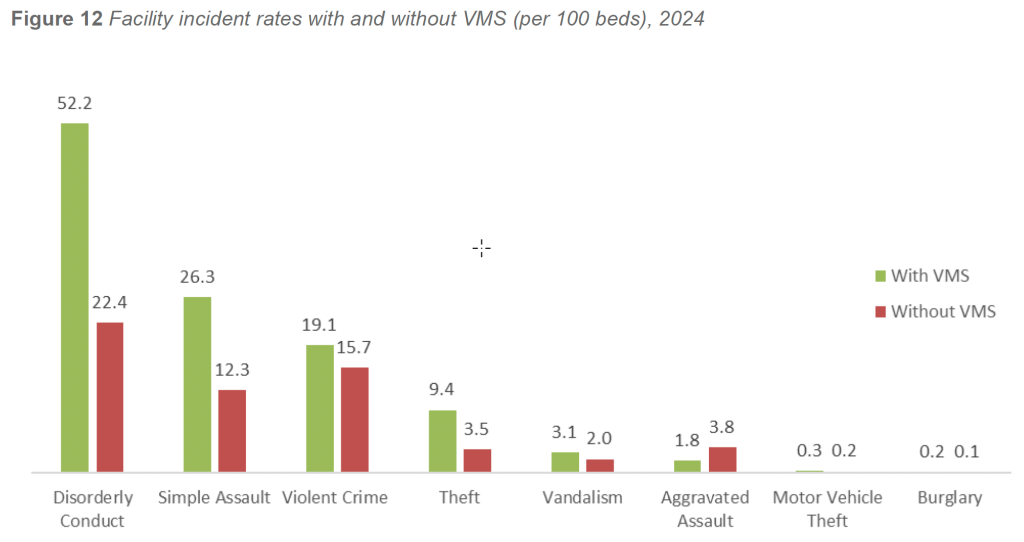
Weighted analysis of 2024 incident data indicates that facilities with VMS reported higher overall incident rates than facilities without VMS. Facilities operating a Visitor Management Program averaged 56.7 incidents per 100 beds, compared with 42.3 incidents per 100 beds in facilities without VMS.
This pattern persisted across multiple crime and behavioral categories. Facilities with VMS reported higher rates of:
- Simple assault (26.3 per 100 beds, compared with 12.3 per 100 beds in facilities without VMS)
- Disorderly conduct (52.2 versus 22.4 per 100 beds)
- Theft (9.4 versus 3.5 per 100 beds)
Rates of vandalism and motor vehicle theft also trended higher in facilities with VMS. The one notable exception was aggravated assault, which occurred at a higher rate in facilities without VMS (3.8 per 100 beds) compared with facilities with VMS (1.8 per 100 beds). This pattern likely reflects the increased vulnerability of smaller or less controlled environments, where fewer formal access restrictions and visitor screening measures may be in place.
As observed in prior survey cycles, these differences reflect exposure, operational complexity, and reporting fidelity, rather than increased inherent violence. Facilities with VMS are typically larger, busier environments with higher public access, more behavioral health exposure, and more comprehensive incident reporting infrastructures.
Summary and Implications
The presence of a VMS Program should be understood as an indicator of organizational maturity, access control discipline, and risk visibility, not as a driver of increased crime or behavioral incidents. Facilities with VMS consistently report higher incident rates because they manage greater public interaction, operate more complex campuses, and possess the systems necessary to identify, document, and analyze security events.
Consistent with IAHSS guidance, effective visitor management supports early identification of unauthorized access, inappropriate behavior, and potential threats while reinforcing expectations for safe and appropriate conduct within healthcare environments. Facilities that deploy VMS are better positioned to manage visitor flow, protect vulnerable populations, and support coordinated response to disruptive or threatening behavior.
Taken together, the 2024 findings and historical data reinforce the role of Visitor Management Programs as a foundational component of modern healthcare security operations, particularly in facilities facing high visitor volume, elevated behavioral risk, and complex public interface challenges.
Recruiting and Retaining Security Staff
The ability to recruit and retain qualified security personnel remains a critical challenge for healthcare facilities and has direct implications for workforce resilience, incident response capability, and WPV prevention. The 2024 survey again assessed recruiting and retention conditions by asking facilities to rate the overall difficulty of hiring security staff using a five-point scale ranging from Very Easy to Very Difficult.
This analysis aligns with IAHSS Healthcare Security Industry Guideline 06 Security Personnel Recruiting and Selection, which emphasizes structured hiring processes, workforce competency, and alignment between staffing models and facility risk profiles, as well as Guideline 01.05 Program Measurement and Improvement, which supports the use of workforce and incident metrics to inform staffing strategies and resource planning.
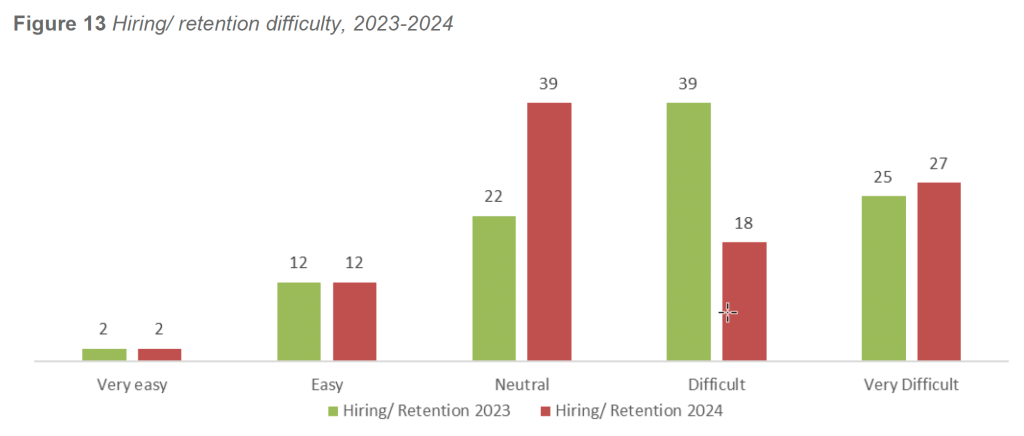
Consistent with 2023 findings, the majority of facilities in 2024 reported hiring conditions in the Neutral, Difficult, or Very Difficult categories. Very few facilities characterized recruitment as Easy or Very Easy.
IAHSS Foundation – 2025 Healthcare Crime Survey Report Page 19 These results reflect persistent national workforce shortages, competition for qualified personnel, wage pressure, and the increasing complexity of the healthcare security role.
Although earlier Crime Surveys did not capture recruitment difficulty, comparison of the 2023 and 2024 datasets reveals consistent patterns. Facilities reporting greater hiring difficulty tend to operate larger campuses, employ more security FTEs, and experience higher incident volumes than facilities reporting more favorable hiring conditions.
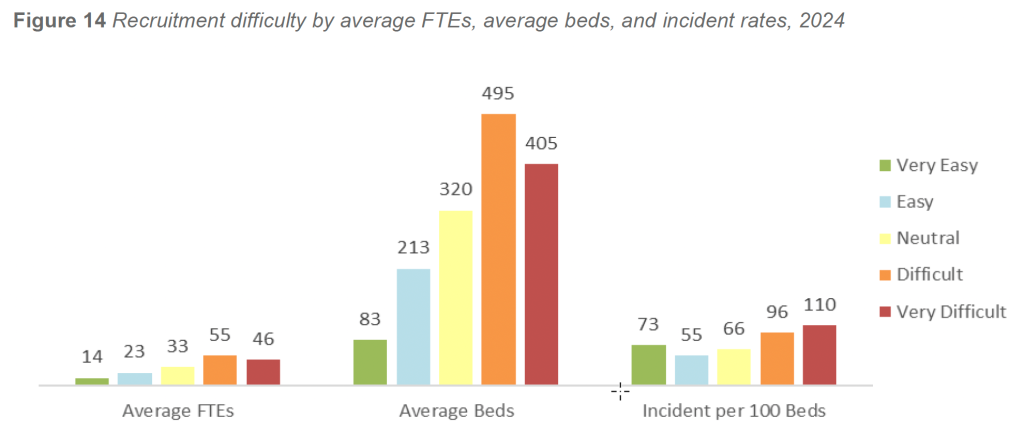
In 2024, facilities reporting Difficult or Very Difficult recruitment conditions operated at substantially greater scale than those reporting Easy or Very Easy conditions. Facilities in the most challenging hiring categories averaged approximately 400 to 495 licensed beds and 46 to 55 security FTEs, compared with 83 to 213 beds and 14 to 23 security FTEs in facilities reporting easier hiring conditions. In practical terms, facilities facing the greatest hiring challenges manage two to four times the staffing footprint and two to six times the bed capacity of facilities reporting the least difficulty.
Incident exposure followed a similar gradient. Facilities reporting Very Difficult recruitment conditions experienced weighted incident rates exceeding 110 incidents per 100 beds, compared with approximately 55 to 75 incidents per 100 beds among facilities reporting Easy or Neutral conditions. This pattern reflects predictable differences in operational intensity: larger facilities, particularly those with behavioral health units, high-volume emergency departments, or regional referral roles, encounter substantially higher levels of disruptive, violent, and behavior-driven incidents.
Importantly, these relationships persisted even after adjusting incident rates to exclude zero-bed facilities and statistical outliers. The continued alignment between recruitment difficulty, facility scale, and incident burden confirms that these differences reflect genuine operational realities rather than artifacts of data distribution or reporting variability.
Summary and Implications
The 2023–2024 findings demonstrate that recruiting and retention challenges in healthcare security are structurally linked to facility size, behavioral acuity, and operational complexity, rather than isolated workforce management issues. Facilities reporting the greatest hiring difficulty are consistently those managing the most demanding environments—large campuses, high-acuity patient populations, elevated WPV exposure, and extensive public interface.
Rather than signaling organizational weakness, recruitment difficulty functions as a leading indicator of operational intensity and security risk. Facilities facing higher incident volumes require larger, more skilled security teams, which in turn face greater competition, burnout risk, and training demands.
These findings reinforce the need for deliberate workforce strategies, including expanded recruitment pipelines, competitive compensation and benefits, professional development pathways, role clarity, and staff wellness initiatives. Facilities can use these benchmarks to contextualize their staffing challenges, assess whether recruitment difficulty aligns with expected patterns for similar organizations, and support data-driven decisions related to staffing models, resource allocation, and long-term workforce sustainability.
Security Staffing per 100 Beds
Distribution Security staffing levels remain a critical indicator of a facility’s ability to respond effectively to crime, WPV, and behavioral risk. The 2024 survey examined the relationship between licensed bed count and budgeted security FTE positions to better understand how staffing scales across healthcare facilities of varying size and complexity.
This analysis aligns with IAHSS Healthcare Security Industry Guideline 02.01 Security Staffing and Deployment, which emphasizes that no single staffing formula is appropriate for all facilities and that staffing decisions should be informed by security vulnerability assessments, patient acuity, service mix, and operational demands. It also aligns with Guideline 01.05 Program Measurement and Improvement, which supports the use of normalized staffing metrics to benchmark and justify resource allocation.

Analysis of the 2024 dataset demonstrates a strong positive relationship between facility size and security staffing levels. The correlation between licensed bed count and budgeted security FTEs was r = 0.901, indicating that staffing expands consistently as facilities increase in size. This finding mirrors results from every IAHSS Foundation Crime Survey since 2016, all of which have reported correlations exceeding r = 0.85.
Across all responding facilities, the average staffing level was 8.4 security FTEs per 100 beds, while the median staffing level was 18 FTEs per 100 beds. The divergence between the mean and median reflects a skewed distribution driven by the wide diversity of facility size, mission, and operational complexity.
When stratified by bed count, three distinct staffing patterns emerged:
- Minimum-Staffing Facilities (1–100 beds)
Small facilities exhibited the highest staffing ratios, averaging 24.6 FTEs per 100 beds. This elevated ratio reflects minimum 24/7 coverage requirements rather than increased incident exposure. Regardless of bed count, these facilities must maintain baseline staffing to support continuous operations, emergency response, and after-hours coverage. - Efficiency-Band Facilities (101–1,000 beds)
Mid-sized facilities demonstrated the most consistent staffing ratios, typically ranging between 8 and 13 FTEs per 100 beds. These facilities often benefit from stable workflows, fewer specialty units, and efficient deployment models that allow staffing to scale proportionally with size. - Complexity-Driven Facilities (1,000+ beds)
Very large facilities reported the highest absolute staffing levels, with total security FTEs ranging from approximately 126 to 476. Staffing ratios increased again to an average of 11 to 12 FTEs per 100 beds, reflecting the operational demands of behavioral health units, trauma centers, high-volume emergency departments, extensive visitor traffic, and multi-campus environments.
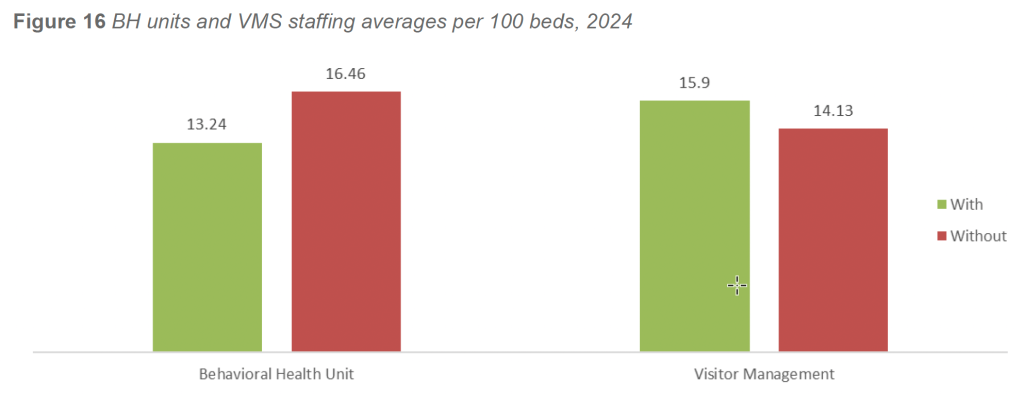
Additional stratification by facility characteristics further illustrates the influence of operational complexity on staffing ratios. Facilities with inpatient behavioral health units reported an average of 13.24 FTEs per 100 beds, compared with 16.46 FTEs per 100 beds in facilities without BH units. This difference is influenced by a small number of very large non-BH facilities with exceptionally high staffing totals, which elevate the average. In practice, facilities with BH units continue to maintain substantial absolute staffing levels to support heightened behavioral acuity, continuous observation, and crisis response demands.
Facilities operating a formal Visitor Management Program reported higher staffing ratios than those without. Facilities with VMS averaged 15.9 FTEs per 100 beds, compared with 14.1 FTEs per 100 beds in facilities without VMS. This pattern reflects the increased access control requirements, public interface management, and operational complexity associated with high visitor volume environments.
Summary and Implications
The 2024 findings reinforce that security staffing levels are best understood through the combined lenses of facility scale, behavioral acuity, and operational intensity, rather than bed count alone. While no national benchmark exists for “appropriate” security staffing per 100 beds, consistent patterns emerge across the dataset. Most U.S. healthcare facilities fall within a range of approximately 8 to 13 security FTEs per 100 beds, with ratios increasing at both ends of the size spectrum due to minimum staffing requirements in small facilities and complexity-driven demands in very large facilities.
Facilities can use these data to compare their staffing levels against similarly sized and similarly structured organizations, identify gaps relative to behavioral and public interface risk, and support evidence-based justification for staffing enhancements. When integrated with incident data, WPV exposure, and facility-specific vulnerability assessments, staffing metrics provide a powerful tool for aligning security resources with clinical realities and organizational mission.
LIMITATIONS
There were several limitations associated with the 2025 Healthcare Crime Survey, including, but not necessarily limited to, the following:
- Sample size and representativeness: The 182 survey responses received represent approximately three percent of hospitals in the United States, leaving roughly 97 percent unaccounted for. While the response volume was consistent with recent years (down slightly from 192 in 2023 and more than 220 in the two years prior), the sample remains self-selected, creating the possibility of sampling bias. As a result, participating hospitals may not be fully representative of the national hospital population.
- Participant recruitment: Survey outreach primarily targeted IAHSS member hospitals. Healthcare facilities without IAHSS-affiliated security leaders or members on staff are therefore less likely to have been included, further limiting sample diversity.
- Data quality and outlier management: Several responses required judgment-based data validation to identify and exclude implausible or incomplete entries. For example, records lacking a licensed bed count or security FTE count were excluded from rate calculations, and one response with implausible incident totals was flagged and removed. These decisions, while made conservatively, introduce the potential for both Type I (exclusion of valid data) and Type II (retention of invalid data) errors.
- Rounding, estimation, and range reporting: Some responses used qualifiers such as “approximately,” “about,” or “+,” suggesting estimation. Where numeric ranges were provided (e.g., “10–16 security employees”), the midpoint was used for calculations. In cases where estimates were clearly provided, the submitted numbers were used as if exact to preserve continuity with prior survey methods. This introduces potential rounding and estimation variance.
- Partial-year program responses: For questions regarding the presence of behavioral health units, threat management teams, or visitor management programs, respondents sometimes indicated partial-year operation. Consistent with prior years, programs in place for six months or longer were counted as “Yes,” while those in place for less than six months were counted as “No.” Responses that indicated operation in “certain areas” were also treated as “Yes.”
- Duplicate representation of systems: Because responses were collected at the individual hospital level, some multi-hospital systems may have been represented more than once. This could potentially inflate or dilute results in certain regions or categories.
- Use of bed counts as denominator: Bed counts remain the primary size metric for calculating crime rates, ensuring continuity with prior IAHSS Foundation Crime Surveys. However, bed count may not be the ideal indicator of facility size or exposure. Other denominators—such as emergency department visits, hospital square footage, average daily census, or adjusted patient days—could offer additional precision if consistently reported. Bed count remains the most widely available and reliable denominator.
- Data entry and definitional inconsistencies: Some data may have been mis-entered or derived using non-standard definitions of crimes. Despite providing Uniform Crime Reporting (UCR) definitions within the survey, respondents may have applied internal definitions or classification systems. Variability in how terms such as “elopement” or “threat management” were interpreted could influence data consistency.
- Outlier influence: A small number of hospitals reporting unusually high incident volumes can significantly affect rate calculations. For instance, a handful of large urban facilities accounted for a disproportionate share of behavioral incidents—consistent with patterns seen in previous survey years. Although data were weighted by bed count and FTE to mitigate this effect, extreme outliers continue to influence aggregate rates for some categories, particularly assaults and disorderly conduct.