
Comparing Your Hospital
To compare your hospital’s crime rate to the statistics above, the following formula can be used to calculate the rate per 100 beds:
Crime Rate = (x / Beds) * 100
where x is the total crime for each crime type and
Beds is the number of beds at your hospital
Example: (17 assaults / 360 beds) = 0.047 * 100 = 4.7 assaults per 100 beds
WORKPLACE VIOLENCE TYPOLOGY
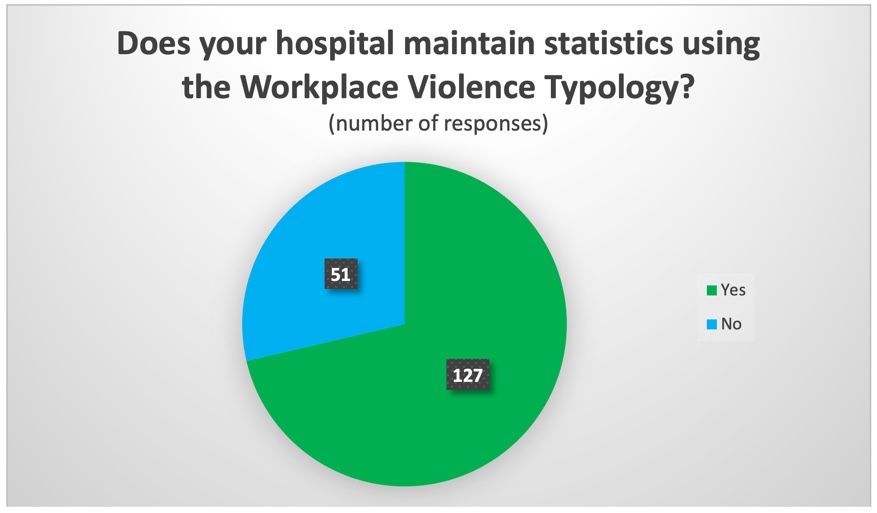
To drill down further into the assault numbers, we asked if hospitals maintain statistics using the Workplace Violence Typology. This classifies both aggravated assaults and simple assaults into four types.
- Workplace Violence Type 1: Violent acts by criminals, who have no other connection with the workplace, but enter to commit robbery or another crime
- Workplace Violence Type 2: Violence directed at employees by customers, clients, patients, students, inmates or any others for whom an organization provides services
- Workplace Violence Type 3: Violence against coworkers, supervisors or managers by a present or former employee
- Workplace Violence Type 4: Violence committed in the workplace by someone who does not work there but has a personal relationship with an employee, e.g., an abusive spouse or domestic partner
Of 178 responses (not including 13 that replied “Don’t Know”), 71 percent said their hospitals use this typology. In the previous survey, 78 percent reported using it.
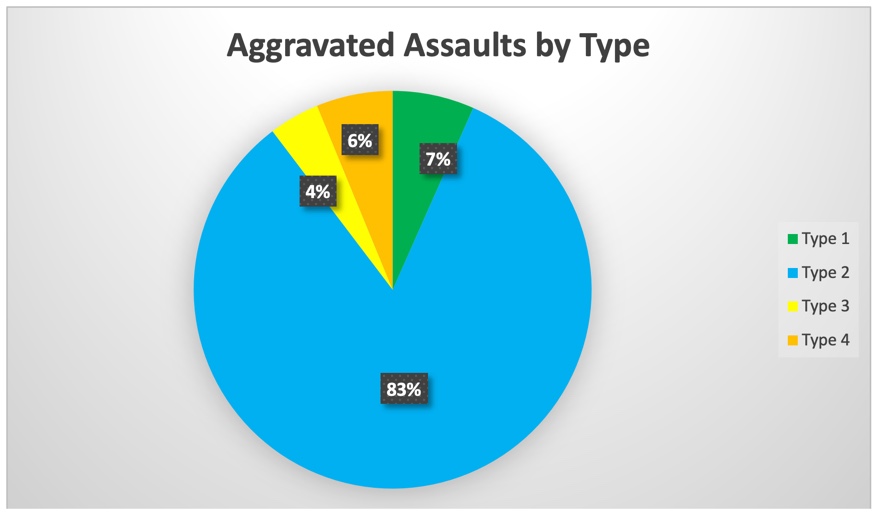
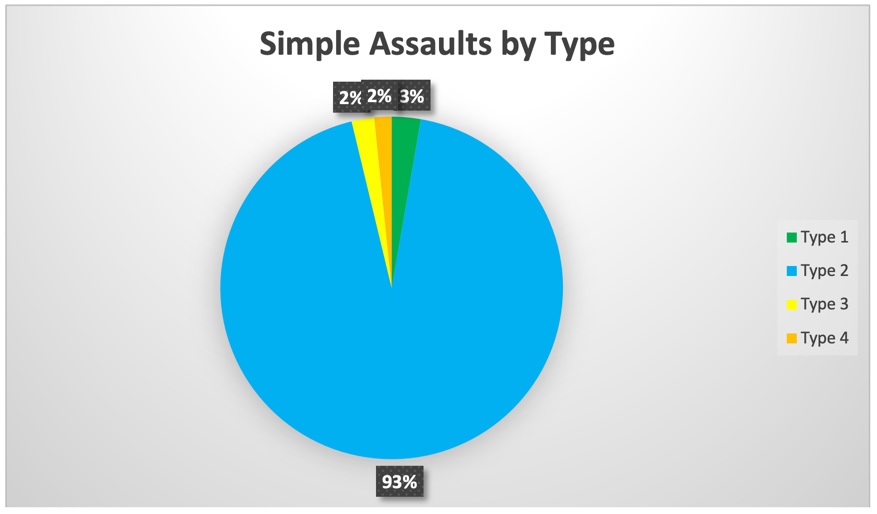
Among those reporting assaults by category, type 2 (violence directed at employees by nonemployees) attacks were, by far, the most common, accounting for 83 percent of aggravated assaults and 93 percent of simple assaults. In 2021, the results were 73 percent and 86 percent, respectively.
ADDITIONAL QUESTIONS
In addition to inquiring about crime data, we asked respondents questions regarding specific aspects of their security operations.
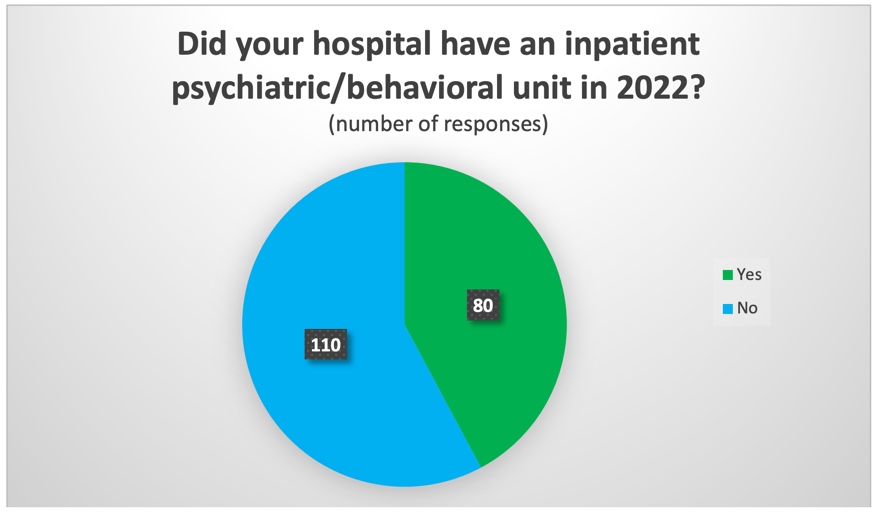
Inpatient Psychiatric/Behavioral Unit
We asked if responding facilities had an inpatient psychiatric/behavioral unit. Of the 190 that provided an answer (not including one “Don’t Know”), 42 percent said yes. In the previous survey, 47 percent said yes.
Respondents with psychiatric/behavioral units tended to have higher rates of violent crime and disorderly conduct. While the overall violent crime rate was 1.9 incidents per 100 beds, the rate
at hospitals with these types of units was 2.5 per 100 beds. The disorderly conduct rates, meanwhile, were 52.2 overall and 56.6 at sites with psychiatric/behavioral units.
Certain data limitations should be noted here, however. A small number of outliers within the category of hospitals with these units drove up the sub-category rates. A single facility with a high number of aggravated assaults was responsible for raising the violent crime rate in this segment by 0.4 incidents per 100 beds, while five hospitals accounted for more than half of all disorderly conduct incidents among those with psychiatric/behavioral units, more than doubling the sub-category rate. Excluding these five facilities, the overall disorderly conduct rate would be 35.7 per 100 beds (instead of 52.2) and the sub-category rate would be 26.2 (instead of 56.6).
Threat Management Teams
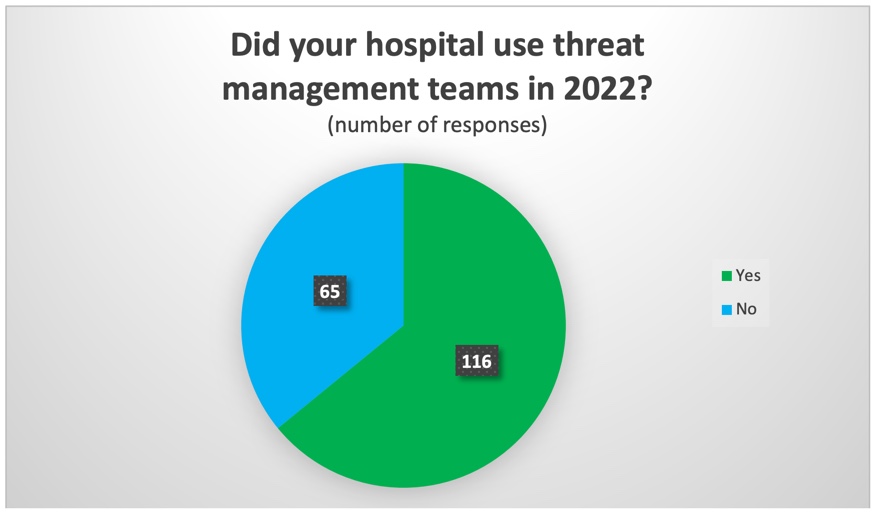
We asked respondents if their hospital uses threat management teams in security operations.
Although the term was not defined in the survey, a threat management team, generally speaking, is a tool aimed at reducing workplace violence by bringing together individuals from various departments within an organization to assess threats, develop countermeasures, and intervene before violence occurs. Of 181 responses (not including 10 responses of “Don’t Know”), 64 percent said they do use threat management teams. In the previous survey, 57 percent reported using these teams.
No major differences were seen in the data between hospitals that use threat management teams and hospitals overall. Last year’s report found that facilities that use such teams tended to have larger security staffs and higher rates of disorderly conduct, simple assault, and elopement. It was suggested in that report that “it may be the case that hospitals facing higher rates of crime are more likely to implement threat management teams and similar measures.”
Visitor Management Programs
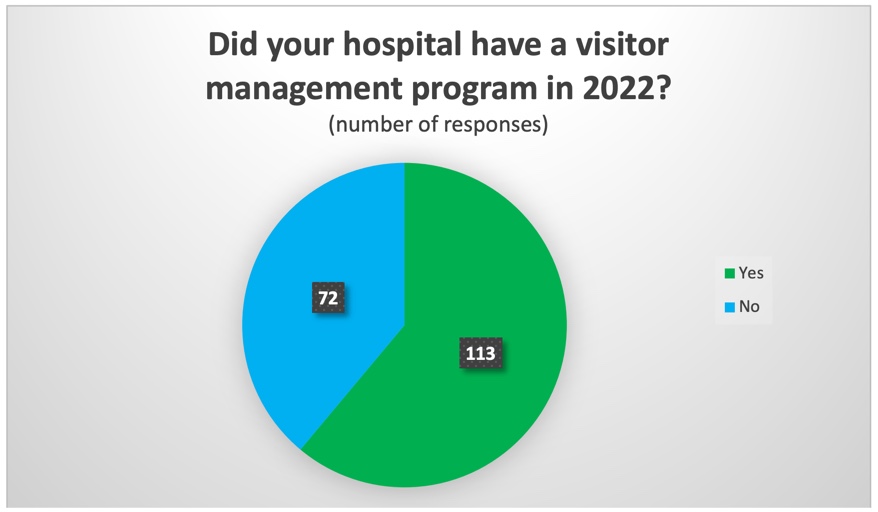
We asked if hospitals used visitor management programs to track entry and exit to and from their facilities by people other than staff and patients. Of 185 responses (not including six that answered “Don’t Know”), 61 percent said yes. In the previous survey, 82 percent reported having such programs in place.
Hospitals with visitor management programs had higher aggregate rates of simple assault and disorderly conduct than the all-hospital rates – 27.1 incidents of simple assault per 100 beds compared to 22, and 60.5 incidents of disorderly conduct per 100 beds compared to 52.2.
This is similar, though smaller in size, to differences observed in last year’s report. As noted then, no conclusions should be drawn about the effectiveness of visitor management programs based on these results because, among other possibilities, hospitals facing higher rates of crime may be more likely to deploy such measures.
Recruiting and Retaining Security Staff
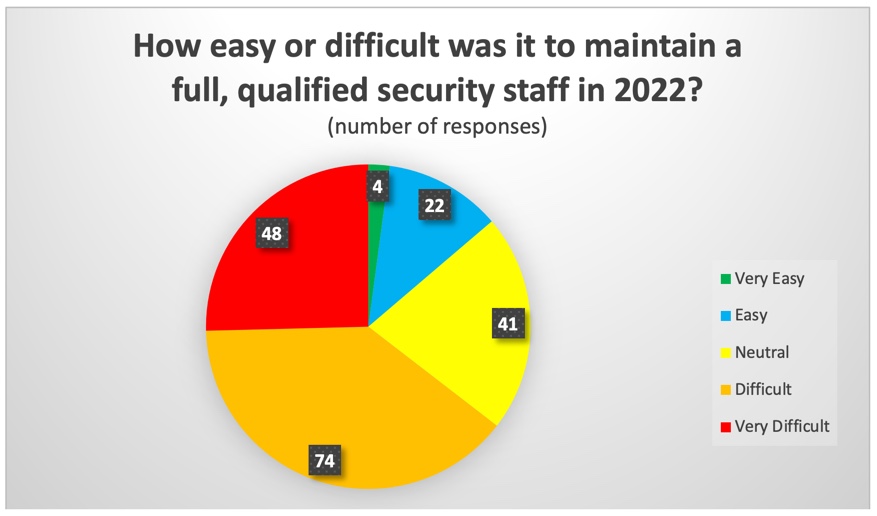
This year, for the first time, we asked respondents to gauge the difficulty of recruiting and retaining a full, qualified security staff. Of 189 responses, 4 described the process as “Very Easy,” 22 said “Easy,” 43 were “Neutral,” 74 said “Difficult,” and 48 said “Very Difficult.” So, overall, 14 percent reported relative ease in filling security staffs, while 65 percent reported experiencing varying degrees of difficulty.
Hospitals reporting that it was “Difficult” or “Very Difficult” to keep their security departments fully staffed had an average of 10 security personnel per 100 beds, while those reporting having an “Easy” or “Very Easy” time had an average of 7.7, suggesting that recruiting and retention challenges increase as staffs grow larger. However, it should be noted that the total of “Easy” and “Very Easy” responses was a small sample size (14).