DATA ANALYSIS
Crime Rates
Raw crime levels do not provide much context, particularly given the varying sizes of the hospitals across the United States. To provide context and based on lessons learned during previous Healthcare Crime Surveys, the 2019 Healthcare Crime Survey collected bed counts for each hospital. As a surrogate indicator of hospital size, hospital beds allow for the calculation of crimes rates (per 100 beds) and provide the ability to trend crime rates over time and to compare this year’s Healthcare Crime Survey results to prior years.
Crime rates are used to provide context and allow for comparisons between hospitals of different sizes. Bed counts were used based on experience from prior crime surveys where additional size and population indicators were collected. That experience informed the decision to use bed counts as other indicators were more challenging to obtain and not consistently reported via prior Healthcare Crime Surveys.
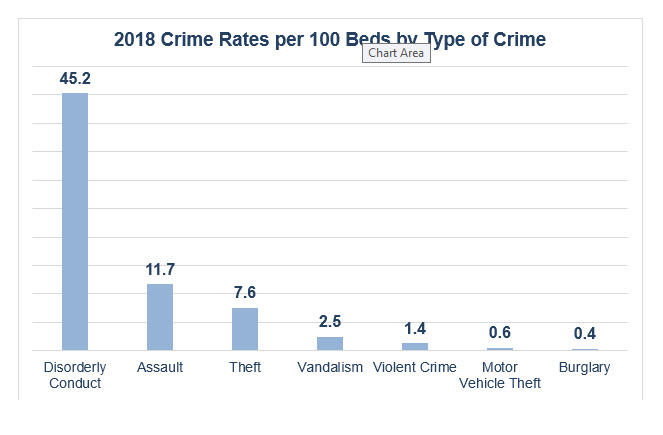
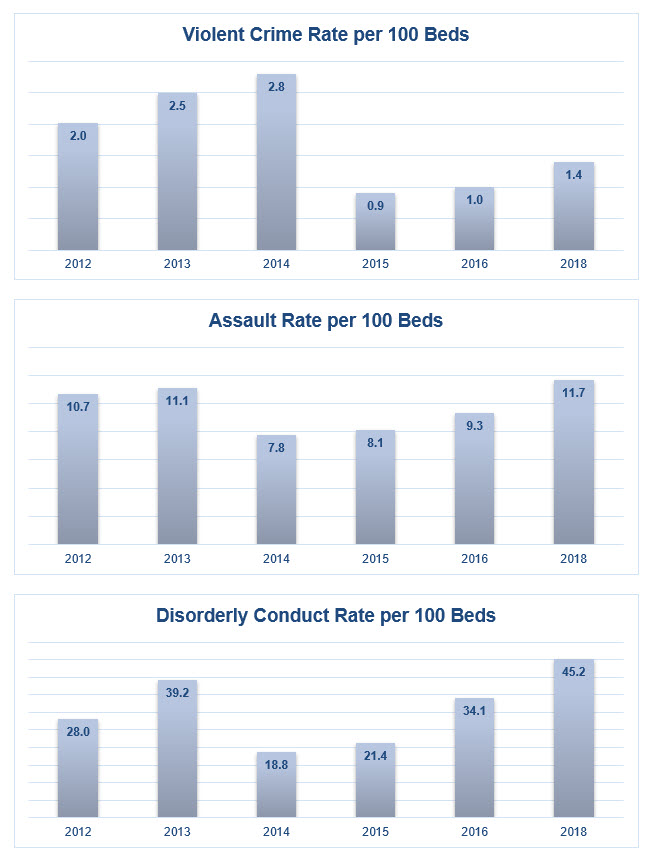
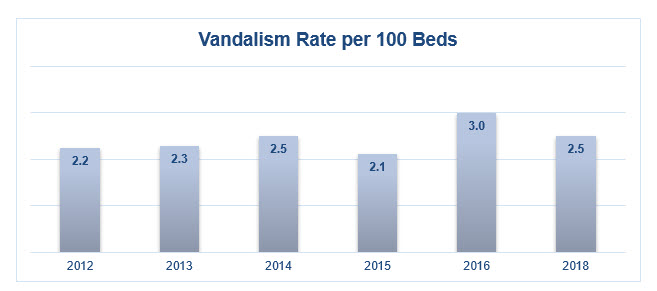
The first graph below compares the 2018 crime rates per 100 beds for each crime (n = 345). The subsequent graphs in this section display the crime rate trends from 2012 to 2016 and 2018 (n = 345).[1] For analytical purposes and consistent with FBI practice, Murder, Rape, Robbery, and Aggravated Assault were aggregated into one group called Violent Crime.
[1] There was insufficient data to include 2017 data.